When Does Mandatory Price Disclosure Lower Prices?
Evidence from the German Fuel Market
Abstract
The widespread availability of digital technologies has made
mandatory price disclosure policies (MPD) a convenient tool for
policymakers to increase price transparency and foster competition. The
literature has shown that these can increase or decrease prices. We shed
light on the circumstances under which MPD lowers prices. We study the
introduction of MPD in the German retail fuel market by combining a
stylized theoretical model with detailed data on prices, seller
characteristics and consumer information. We find that low levels of
prior consumer information, a high number of sellers, and complementary
information campaigns foster the procompetitive effects of MPD.
When Does Mandatory Price Disclosure Lower Prices? Evidence
from the German Fuel Market
Felix Montag, Alina Sagimuldina and Christoph
WinterMontag:
New York University, Stern School of Business (email:
felix.montag@nyu.edu); Sagimuldina: Charles River Associates (email:
asagimuldina@crai.com); Winter: EY-Parthenon (email:
christophwinter@me.com). We thank Itai Ater, Jorge Alé-Chilet, David
Byrne, Anna Gumpert, Fernando Luco, Lars Nesheim, Oren Rigbi, Monika
Schnitzer, Martin Watzinger, Joachim Winter, Ali Yurukoglu and
participants of the Stanford IO Workshop, 2019 CEPR/JIE School on
Applied Industrial Organisation, 2019 EARIE Annual Conference, 2019
MaCCI Annual Conference, and 2018 Jerusalem School in Economic Theory
for helpful comments and suggestions. We thank Marissa Hindelang for
excellent research assistance. Montag gratefully acknowledges financial
support from the German Research Foundation (DFG) through CRC/TRR190
(Project number 280092119). Montag and Winter thank the International
Doctoral Program “Evidence-Based Economics” of the Elite Network of
Bavaria, and Sagimuldina thanks the Research Training Group “GRK 1928 -
Microeconomic Determinants of Labor Productivity” of the Deutsche
Forschungsgemeinschaft for financial support. Edited by Matthew
Grennan.
In many markets, sellers have been found to derive market power from
consumers’ being imperfectly
informed.Examples
include fuel stations in Chile (see (Luco 2019)) and Germany (see (German Federal Cartel Office
2011)), supermarkets in Israel (see (Ater and Rigbi 2023)), and the hospital
medical equipment market in the United States (see (Swanson 2020)).
With the widespread availability of digital technologies, policymakers
across jurisdictions have started introducing mandatory price disclosure
policies (MPD) in many of these markets. The literature finds that these
policies sometimes benefit and sometimes harm
consumers.Even
within retail fuel, Luco
(2019) finds that MPD increases prices, whereas Rossi and Chintagunta
(2016) find that it decreases prices. This suggests that
contextual circumstances such as prior information, market structure,
and policy design determine the effects of MPD. Understanding how these
factors mediate the competitive effects of MPD is crucial for
policymakers, who need to predict its effect before introducing it.
In this paper, we shed light on the circumstances under which
mandatory price disclosure policies foster competition and explore how
complementary policies can enhance this effect. In our theoretical and
empirical analysis, we hone in on several mediators: consumer
information prior to MPD, the number of sellers, and complementary
information campaigns. We specify a stylized model in which consumers
are imperfectly informed about prices and have heterogeneous costs of
accessing an information clearinghouse (e.g., a smartphone app
containing all prices). We use this model to simulate how MPD, modeled
as a reduction in the clearinghouse access costs for all consumers,
affects prices. Subsequently, we test the simulation predictions
empirically by studying the introduction of MPD in the German retail
fuel market, using high-frequency, station-level price changes for
Germany and France before and after the introduction of MPD.
The stylized model features sellers of a homogeneous good who set
prices and consumers who inelastically demand a unit of the good but do
not know the price of individual sellers. As in Tappata (2009), consumers have the
option to purchase access to an information clearinghouse at a fixed
cost, after which they know all prices. These costs differ between
consumers. A consumer purchases access if her expected saving from being
informed is greater than her individual access costs. We model MPD as
lowering the clearinghouse access costs for all consumers by a constant
amount. Once consumers decide whether to purchase access to the
information clearinghouse, the model boils down to a Varian (1980) model, in
which sellers set prices using mixed strategies, informed
consumers purchase at the lowest price seller and uninformed
consumers visit a single seller, observe its price and decide whether to
purchase at that price or not purchase at all.
Several predictions emerge from the simulations: First, marginally
reducing clearinghouse access costs (e.g., through MPD) increases the
equilibrium share of informed consumers but does so to a lesser extent
the higher is the share of informed consumers pre-MPD, which we call the
share of ex ante informed consumers. Second, if the share of ex ante
informed consumers is above a cutoff, a marginal decrease in
clearinghouse access costs reduces the value of information (VOI), a
measure of price dispersion, and does so more markedly the higher is the
ex ante share of informed consumers. Third, if the share of ex ante
informed consumers is above the cutoff, a marginal decrease in
clearinghouse access costs decreases the expected price more than the
expected minimum price. Fourth, a larger reduction in clearinghouse
access costs leads to a larger increase in the share of informed
consumers and decrease in prices. Whereas these predictions are
testable, the model suggests that the share of ex ante informed
consumers, as well as the presence of more sellers, can either increase
or decrease the price effect of MPD.
In September 2013, Germany’s Market Transparency Unit for Fuels (MTU)
started operating. Since then, all fuel stations in Germany have had to
report all price changes in real time to a central database. The
aggregated information can be accessed by information service providers
and diffused to consumers (e.g., via smartphone applications). This
policy was recommended by the German Federal Cartel Office (2011) after
it diagnosed the problem of low competition between fuel stations as
resulting from a lack of knowledge about prices among consumers. Because
we have access to granular data for the periods before and after the MPD
introduction and rich variation along several key dimensions, this
setting serves as a unique laboratory for us to study the mechanisms by
which MPD affects prices.
The station-level price reports to the MTU form the basis of our data
set. To estimate the price effects of MPD, we also need price data for
fuel stations in Germany before its introduction. Here, we leverage
that, even prior to MPD, there already existed some smartphone
applications that allowed users to self-report fuel prices, which were
then collected and diffused to users in a fashion similar to how price
information is released under
MPD.The
usage of these apps before MPD was considerably lower than after its
introduction. This is why the introduction of MPD led to an important
change in consumers’ information set. We have access to the
pre-MPD price notifications from users for one of these apps. This
includes 20.5 million price notifications from between 1 September 2012
and 31 August 2013. For the control group, we exploit the fact that
there exists a similar database of the fuel prices at all fuel stations
in France since 2007.
We use a synthetic difference-in-differences (SDID) design to
estimate the price effects of mandatory price disclosure (see (Arkhangelsky et al.
2021)). To test our predictions about the role of the ex ante
share of informed consumers, we compare the effect of MPD on gasoline
and diesel prices. A key feature of the setting is that the same fuel
stations sell both types of fuel. Other than the fuel type, the overall
product (e.g., the shopping experience) is identical. The key difference
between gasoline and diesel is that consumers of the two fuel types
differ in their incentives to acquire information about prices and so in
their ex ante information levels. In Germany, cars with diesel engines
are driven by consumers who drive on average twice as many kilometers
per year as gasoline buyers. Using data on the pre-MPD user-reported
price notifications, we show that the reporting intensity was higher for
diesel than for gasoline. On the basis of post-MPD user-level search
data, we can show that the app usage intensity remained higher among
diesel than among gasoline consumers. Both of these findings are
consistent with what we would expect theoretically if we compared two
separate markets where consumers have the same valuation for the goods
and the same cost of becoming informed but differ in the number of units
that they demand.
We find that MPD decreases the VOI for gasoline and diesel, which
suggests that the share of ex ante informed consumers was above the
cutoff share in both markets. In this case, the stylized model predicts
that MPD reduces the expected price more than the expected minimum
price. We corroborate this empirically by analyzing their sample
equivalents. For both fuel types, MPD reduces the market-level average
price more than the market-level minimum price. On average, we find that
MPD reduces prices by \(2.7\)% for
gasoline compared to \(1.8\)% for
diesel. The stylized model suggests that this is the case because the
price effects of a larger increase in the share of informed consumers in
the market with fewer ex ante informed consumers (the gasoline market)
outweighs the larger price reduction caused by a marginal increase in
the share of informed consumers in the market with more ex ante informed
consumers (the diesel market).
To ensure that the results are not driven by different demand
conditions, we repeat the analysis for stations 20–100 km from the
France-Germany border. To rule out that our results are driven by
selection bias in the pre-MPD price reports or the choice of control
country, we estimate the effect of MPD on diesel and gasoline prices
using weekly, country-level administrative data and the 26 European
Union member countries except Germany as a control group. Both analyses
yield estimates that are statistically and economically
indistinguishable from the main findings.
Next, we study how the number and identity of sellers affects the
price effect of MPD. To compute the number of sellers in a local market,
we construct overlapping markets where we count the number of rivals
within a 5 km radius around a focal fuel station. Our main finding
suggests that the presence of more sellers leads to a larger decrease in
average prices under MPD. Although these categories play no role in the
stylized model, the German
Federal Cartel Office (2011) focused on the role of vertically
integrated sellers, which operate at the refinery and the retail level,
and, in particular, on a subset of vertically integrated oligopolists,
which are allegedly responsible for higher prices. We find no
differential effect of MPD on integrated sellers as a whole. When we
isolate the integrated sellers defined as integrated oligopolists by the
German Federal Cartel
Office (2011), we find a stronger MPD-induced price decrease for
stations belonging to brands of the integrated oligopolists. This is
encouraging if (one of) the aims of the policy was to rein in the market
power allegedly held by these oligopolists.
Next, we explore the dynamic effects of MPD and levers related to the
design of MPD policies. We show that, whereas the price decrease for
diesel was relatively stable over time, the price decrease for gasoline
was largest approximately five months after the introduction of MPD and
declined to the same level as that for diesel a couple of months later,
after which the price effect remained stable. The large initial price
decrease for gasoline coincided with a fading of the strong initial
public interest in MPD after six months, which we measure by means of
Google searches for MPD-related search terms. At the same time, monthly
usage data for three of the price comparison apps shows that these apps
continued to be used intensely all through 2014, in line with the
persistent price reduction that we find. These results suggest that
complementary information campaigns that remind consumers of the
existence of price information can further reduce prices. We test this
by studying regular broadcasts by local radio stations of the lowest
fuel prices in their reception area after the introduction of MPD. Our
results suggest that this practice can lead to a further price
decrease.
This paper makes two main contributions. First, we specify a stylized
model that allows us to simulate how different market conditions mediate
the price effect of MPD. The model is a simplified version of that of
Tappata (2009),
who studies price cycles in retail fuel markets, and boils down to the
Varian (1980)
model once consumers choose whether to become informed. With an
exogenous share of informed consumers, Pennerstorfer et al. (2020) show
that there is a global inverse U-shaped relationship between the share
of informed consumers and measures of price dispersion, such as the VOI.
Whereas there is a rich theoretical literature describing how increasing
seller information can stabilize collusion (e.g., (Green and Porter 1984; Kühn and Vives
1995)), we assume that seller information is unaffected by MPD
because, according to the German Federal Cartel Office (2011),
sellers invested heavily in observing their competitors’ prices before
MPD.Schultz (2005), Petrikaite (2016)
and Schultz
(2017) show that increasing consumer information only can
stabilize collusion. We abstract from these considerations, as they do
not seem empirically relevant in our application.
Second, the detailed data and variation make the German retail fuel
market an ideal laboratory for us to explore the different mechanisms
that can shape the price effects of MPD in a single application. Our
findings relate to a rich empirical literature studying the price
effects of various MPD policies and finding mixed results. Albæk et al. (1997) and
Luco (2019) find
that MPD in the Danish ready-mix concrete and Chilean retail fuel
markets increased prices because it improved seller information. Ater and Rigbi (2023) find
that MPD for Israeli supermarkets intensified competition as low-price
supermarket chains used MPD-enabled price comparisons to lend
credibility to their price-based advertising campaigns. Rossi and Chintagunta
(2016) find that mandating that fuel stations on Italian
motorways post rivals’ prices lowered
prices.Brown (2019b) and Brown (2019a) find that
increasing price transparency decreased out-of-pocket prices for medical
imaging procedures in New Hampshire and shifted sales toward lower-price
sellers.
Since a key feature of our setting is that we can shed light on
different aspects of the effect of MPD policies, after our analysis, we
discuss the policy implications of our results and findings from prior
literature. We conclude that the most promising intervention is to
target MPD at markets with a low ex ante share of informed consumers but
a high degree of seller information. Similarly, markets that have a high
number of sellers but are far from the perfectly competitive price are
likely to benefit most from MPD. A comparison of our findings with those
of Luco (2019) and
Wu (2023) suggests
that MPD is most likely to be successful at lowering prices if consumer
uptake is high. This can be facilitated by low entry barriers for
consumer apps and complementary information campaigns. Another policy
lever is explored by Martin (Forthcoming), who goes beyond
studying the simple binary decision of whether to introduce MPD and
instead explores whether diffusing only a subset of prices to consumers
can lower prices even further. He finds an inverse U-shaped relationship
between the share of prices disclosed and consumer welfare, with the
effect maximized by the display of only the cheapest 20% of prices.
Finally, our paper contributes to an extensive empirical literature
that analyzes pricing decisions in retail fuel
markets.Eckert (2013) provides
an overview of the earlier literature on pricing in fuel markets.Lewis (2008)
studies the relationship between price dispersion and the local
competitive environment. A key consideration in this literature is the
role of imperfect information (e.g., (Chandra and Tappata 2011), (Byrne and Roos 2017) and
(Byrne and de Roos 2022)). In contrast,
Houde (2012)
emphasizes the role of spatial differentiation. Byrne and de Roos
(2019) and Assad et
al. (2024) study how humans and algorithms learn to tacitly
coordinate on softer competition and higher prices. Although
understanding pricing decisions and the source of price dispersion in
fuel markets is interesting in and of itself, Genakos and Pagliero (2022) and Montag et al. (2023)
show how these mechanisms channel the pass-through of commodity taxes
and thus have broader implications for the effectiveness of other policy
tools.
The remainder of this paper is structured as follows: Section 2 outlines the theoretical model.
Section 3 describes the setting and the
data. Section 4 provides descriptive evidence
on the effects of MPD. Section 5
presents the empirical design and Section 6 the
empirical results. Section 7
discusses policy implications, and Section 8
concludes.
Stylized Model
To guide our empirical analysis, we specify a stylized information
clearinghouse model in the spirit of Varian (1980), in which consumers can
endogenously choose to become informed as in Tappata (2009).
Setup
The model features sellers and consumers. Sellers sell a homogeneous
good and set prices. There is a unit mass of atomistic consumers who
each inelastically demand a single unit of the good. The valuation of
the good is the same across consumers and is denoted by \(\upsilon\). Consumers can buy access to an
information clearinghouse (e.g., a price comparison app). Once they have
access to this clearinghouse, they know all prices and buy from the
lowest-price seller. If they do not, they draw a single seller at
random, observe its price, and can decide only between buying and not
buying at that price.
Consumers differ in the costs they incur to obtain access to the
information clearinghouse. A fraction \(\lambda\) of consumers are
shoppers. They have negative clearinghouse access costs and
therefore always know all prices. The remaining \((1 - \lambda)\) consumers are
nonshoppers. They have clearinghouse access costs drawn from a
continuous and differentiable probability density function \(g(z_i)\), with \(z_i \in Z = [0, z_{max}]\). \(z_{max}\) is sufficiently high that some
consumers never choose to become informed.
On the supply side, there is a fixed and exogenous number of
symmetric sellers. Each seller produces the homogeneous good at a
marginal cost of production normalized to zero. We denote the number of
firms by \(N\), and sellers are indexed
by \(j\).
Sellers and consumers play a simultaneous-move Bayesian game. They
form expectations about consumers’ decision to become informed and about
rivals’ prices and choose a pricing strategy to maximize expected
profits. Sellers choose a price \(p_j \in P =
[0, \upsilon]\). Consumers form expectations over prices when
deciding whether to become informed. They choose an action \(a_i \in A = \{0, 1\}\), where \(a_i = 1\) means that they buy access to the
information clearinghouse. We call consumers who buy access to the
information clearinghouse informed and all other consumers
uninformed. The share of informed consumers is denoted by \(\mu = \int_0^1 a_i di\). Since no seller
chooses a price above the valuation of consumers, they always purchase a
single unit of the good.
We model mandatory price disclosure as decreasing the clearinghouse
access costs for all consumers by the same amount. This means a parallel
shift of the clearinghouse access cost curve \(z_i\) to the right. Two components are
important in clarifying the price effects of MPD: how a shift in \(z_i\) affects the equilibrium share of
informed consumers \(\mu\) and how this
change in \(\mu\) affects prices.
To analyze these two components, we first illustrate the
simultaneous-move Bayesian equilibrium and then simulate how the effect
of MPD on prices is mediated by market conditions and the design of the
policy.
Equilibrium
prices and information acquisition
There is a unique symmetric Bayesian Nash equilibrium (SBNE) in which
firms set prices by playing a mixed strategy given the share of informed
consumers and consumers choose to become informed given their correct
belief about the firms’ pricing
strategies.This
is a simplified version of the presentation in Tappata (2009), which features a
detailed discussion of the equilibrium. The equilibrium is
characterized by the density function \(F(p_{i})\) and the closed and bounded
support \([\underline{p}, p_{r}]\).
\(p_{r}\) is the reservation price of
uninformed consumers, and \(\underline{p}\) is the minimum of the
support from which a seller draws prices in equilibrium.
Uninformed consumers purchase the good as long as the price is weakly
below their valuation \(\upsilon\).
Their reservation price \(p_{r}\) is
thus equal to \(\upsilon\). Since no
one purchases at a price above \(\upsilon\), no seller charges a price above
\(\upsilon\) in equilibrium, and all
uninformed consumers buy the good at the randomly drawn seller. The
derivation of the pricing strategies can be found in Varian (1980).
The minimum element of the support from which sellers draw prices is
\[\begin{equation}
\displaystyle \underline{p} = \frac{\upsilon}{\frac{\mu N}{1 - \mu} + 1}
\,. \notag
\end{equation}\]
The cumulative density function from which sellers draw prices is
\[\begin{equation}
\displaystyle F(p) = 1 - \left(\frac{\upsilon - p}{p} \frac{1 - \mu}{N
\mu}\right)^{\frac{1}{N-1}} \,. \notag
\end{equation}\]
The value of information to consumers, i.e., the value from their
knowing all prices, is the savings they expect from buying from the
lowest-price seller instead of the first seller they encounter. The VOI
is therefore the difference between \(E[p]\) and \(E[p_{min}]\). Since consumers are
atomistic, their individual decision to become informed or not has no
effect on \(\mu\). All shoppers, as
well as all nonshoppers with clearinghouse access costs \(z_i \leq VOI = E[p - p_{min} | \mu]\),
become informed.
The equilibrium share of informed consumers is therefore \[\begin{equation}
\displaystyle \mu = \lambda + G\left(E\left[p - p_{min} |
\mu\right]\right) \,. \notag
\end{equation}\]
Finally, the expected price can be written as \[\begin{equation}
\displaystyle E\left[p\right] = \underline{p} + \left( \frac{1 - \mu}{N
\mu} \right)^{\frac{1}{N - 1}} \int^{\upsilon}_{\underline{p}} \left(
\frac{\upsilon - p}{p} \right)^{\frac{1}{N - 1}} dp \,, \notag
\end{equation}\]
and the expected minimum price as \[\begin{equation}
\displaystyle E\left[p_{min}\right] = \frac{1 - \mu}{\mu} \left(\upsilon
- E\left[p\right] \right) \,. \notag
\end{equation}\]
As shown by Tappata
(2009), starting from \(\mu =
0\), the VOI is an increasing function in \(\mu\), and there exists a \(\hat{\mu}\) that maximizes the VOI.
Thereafter, further increasing \(\mu\)
leads \(E[p]\) to decline faster than
\(E[p_{min}]\) and results in a decline
in the VOI.
Depending on the shape of \(g(\cdot)\), there can be more than one
level of informed consumers \(\mu\)
where the VOI equals the clearinghouse access costs for the marginal
consumer. A sufficient (but not necessary) condition for a unique
equilibrium is that \(g(\cdot)\) be a
uniform distribution. Tappata (2009) derives more general
conditions under which there is a unique equilibrium to the consumers’
information acquisition problem.
Effect of mandatory price
disclosure
To understand the effect of mandatory price disclosure on the share
of informed consumers and equilibrium prices, we simulate the key
components of the model. The equilibrium share of informed consumers is
determined by the VOI and the clearinghouse access costs. In this model,
the VOI depends only on the share of informed consumers, the willingness
to pay for the good, \(\upsilon\), and
the number of sellers, \(N\). We model
MPD as a shift to the right of the clearinghouse access cost curve
(i.e., a decrease in clearinghouse access costs by the same amount for
every consumer).
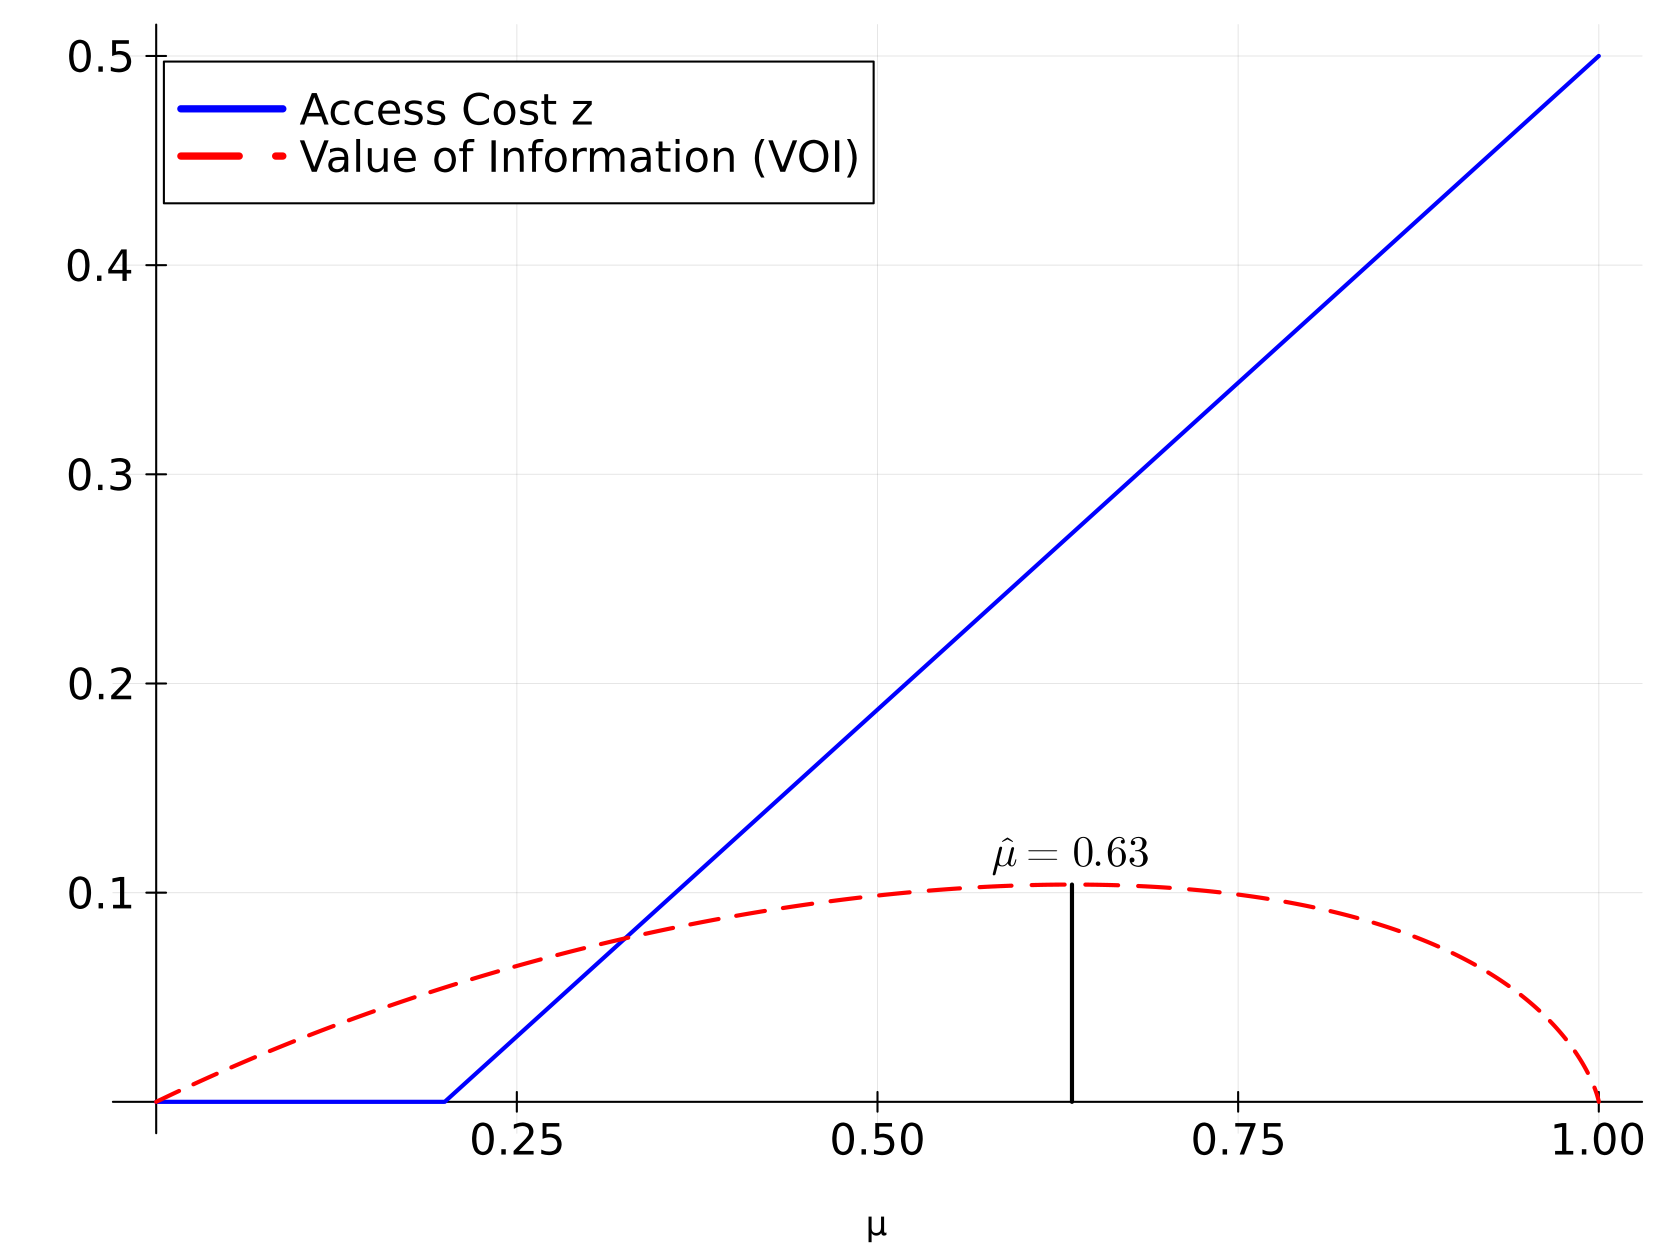
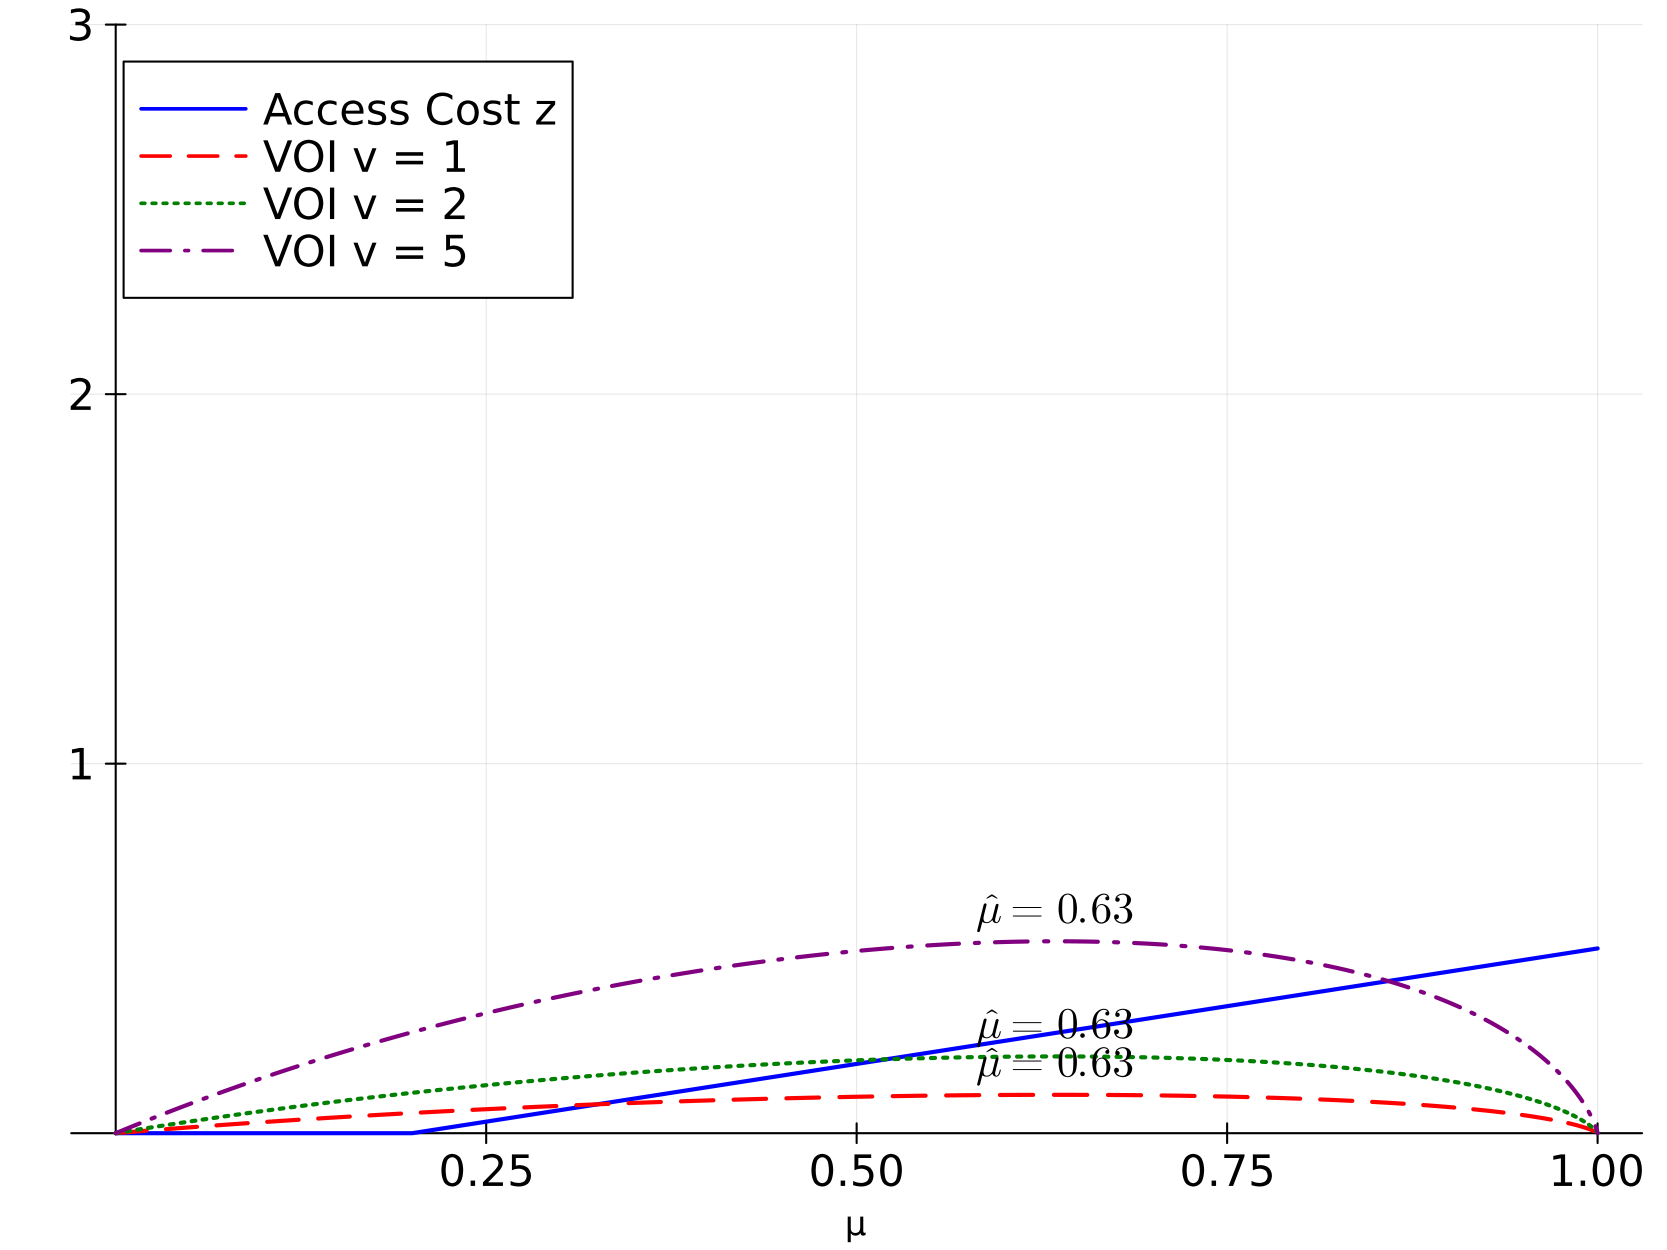
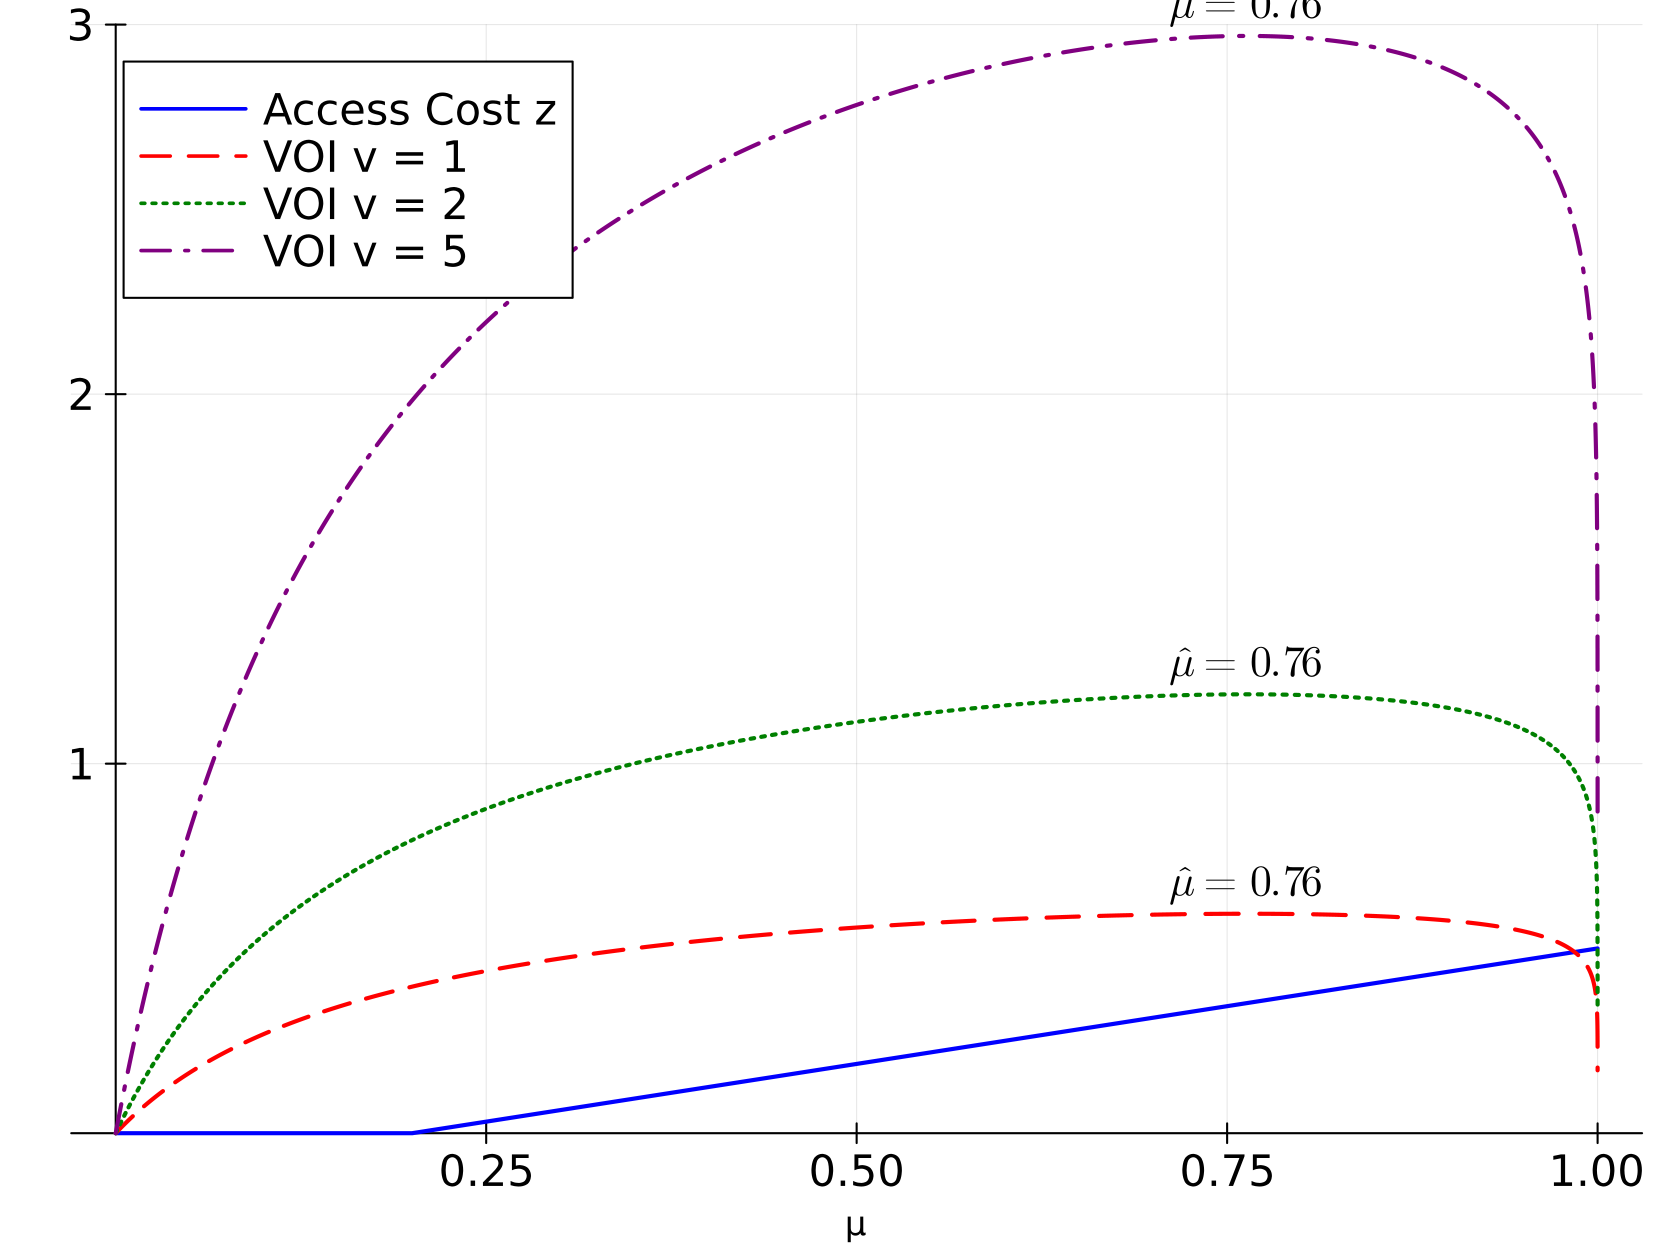
A. \(N = 2\)
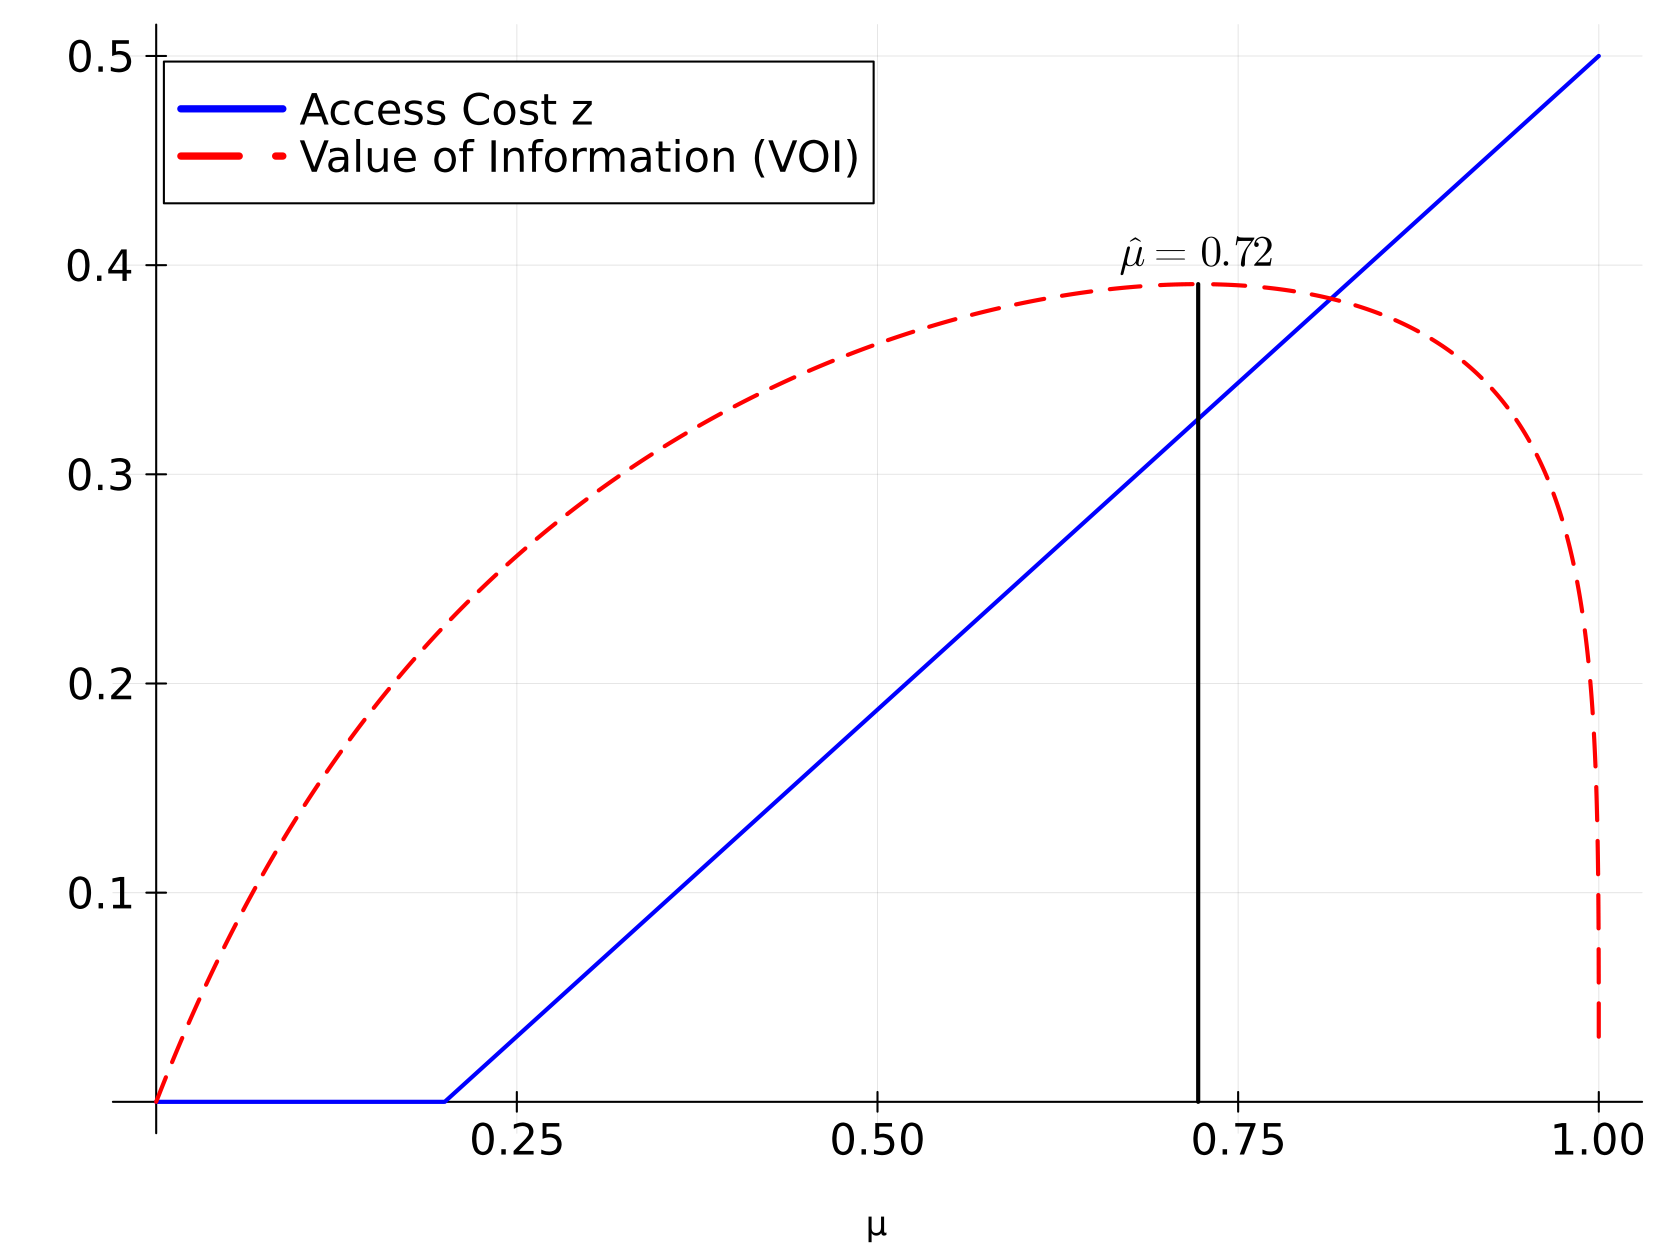
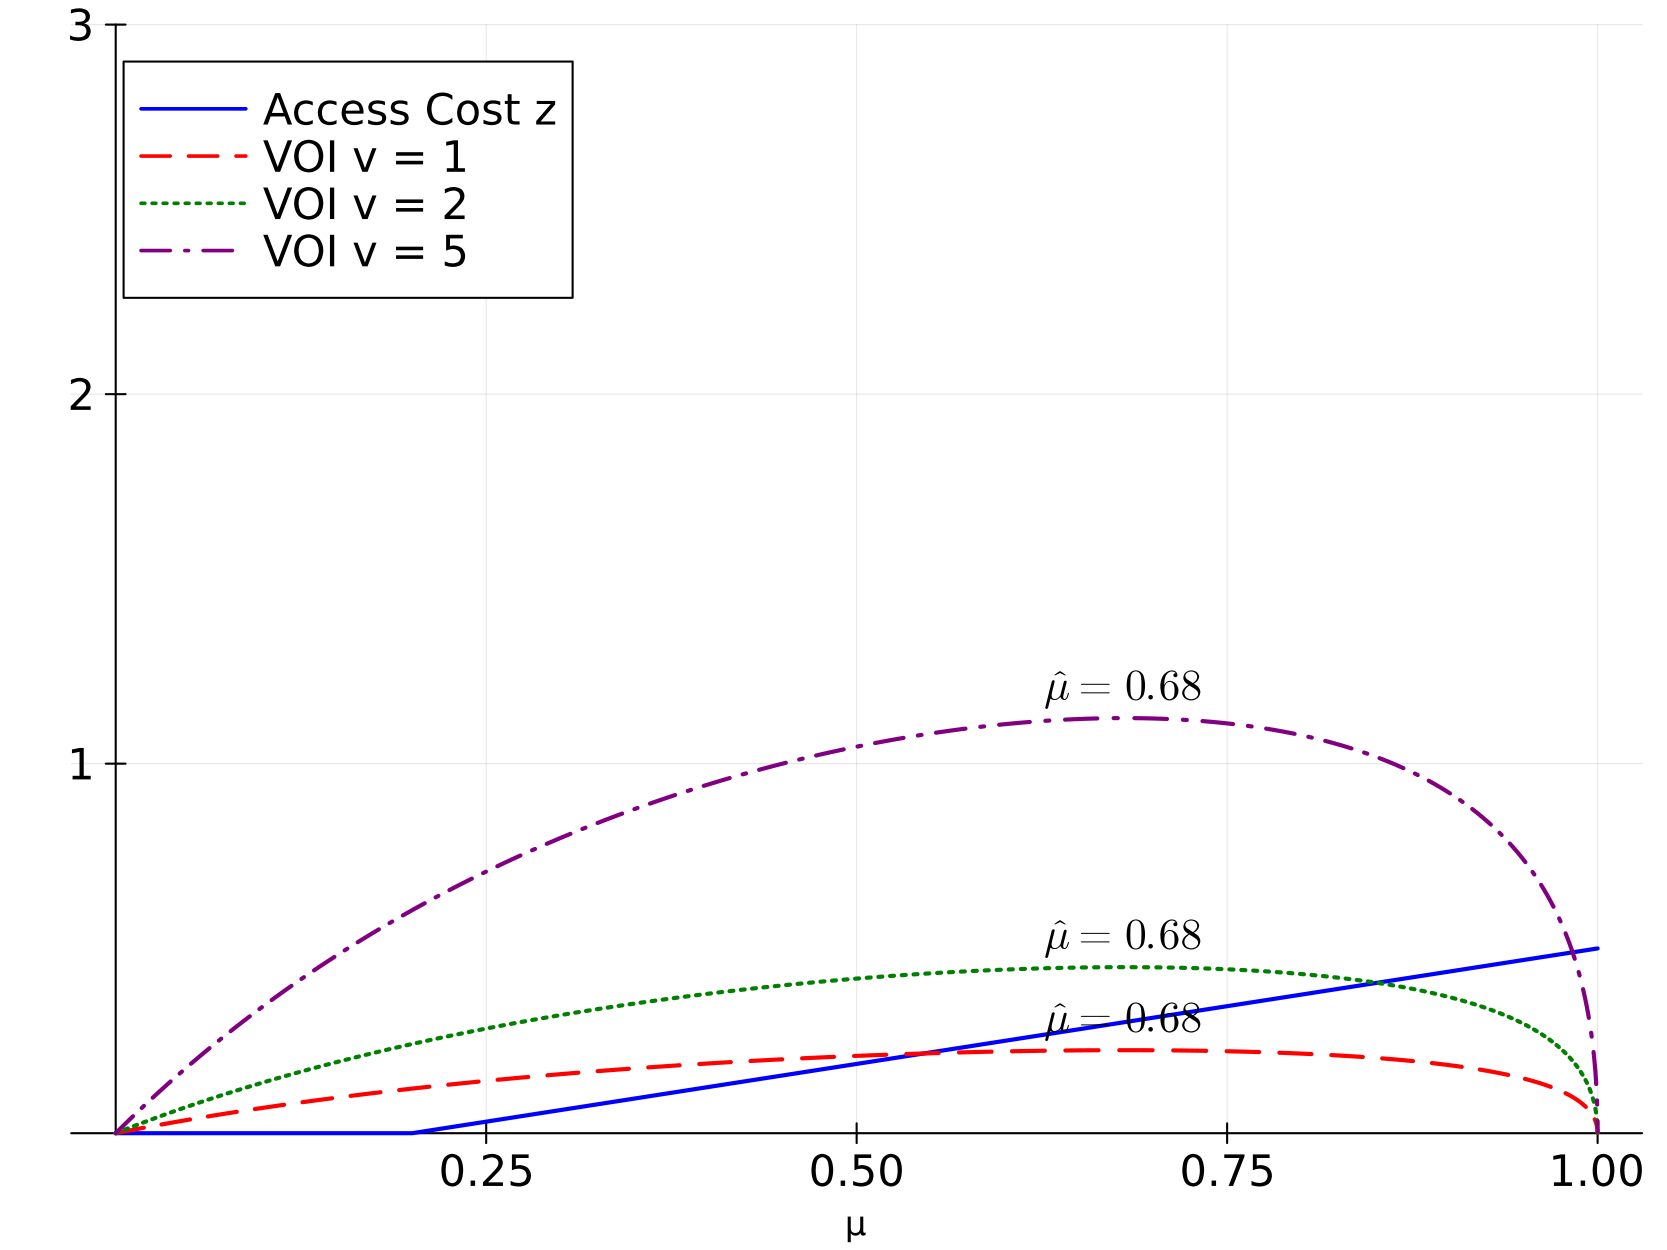
B. \(N = 5\)
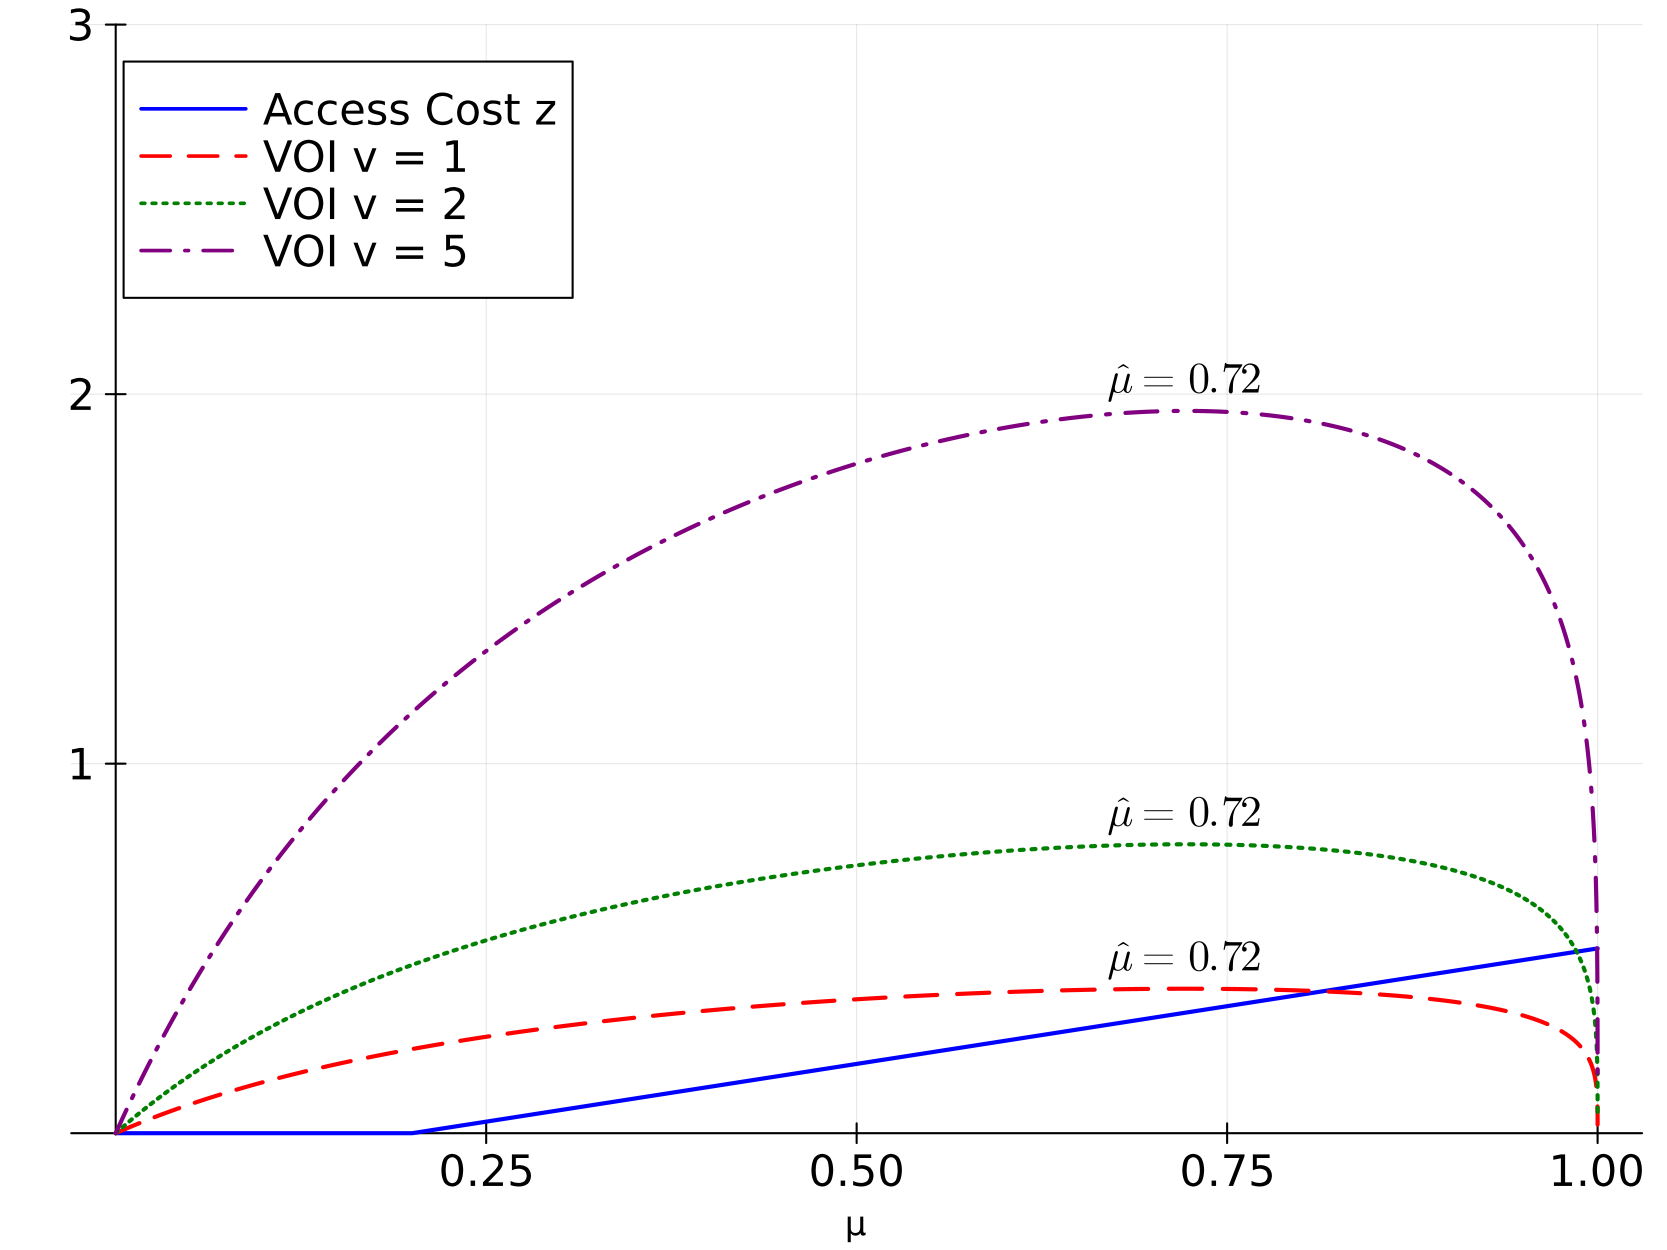
Notes: The figure shows simulations of the VOI and the
clearinghouse access costs by the share of informed consumers. The
clearinghouse access costs are for the marginal consumer if all
consumers with lower costs purchase clearinghouse access. We use the
following parameter values in the simulations: \(\upsilon = 1\), \(\lambda = 0.2\), and a uniform distribution
of access costs between \(0\) and \(1\) for all nonshoppers. Panel A uses \(N = 2\), and Panel B uses \(N = 5\). Appendix Figure A1 shows that the
share of informed consumers maximizing VOI, \(\hat{\mu}\), is independent of \(\upsilon\) and increases in \(N\).
Figure 1: VOI and clearinghouse access
costs by share of informed consumers
Figure 1 plots the VOI and
clearinghouse access costs as a function of the share of informed
consumers. The VOI depends only on \(\upsilon\) and the number of sellers. As we
show in Appendix Figure A1 , the share of informed consumers that
maximizes the VOI, \(\hat{\mu}\), is
independent of \(\upsilon\) and
increases in \(N\). We illustrate the
distribution of clearinghouse access costs among nonshoppers using a
uniform distribution, but our discussion holds more generally for any
continuous and differentiable probability density function that
satisfies the necessary conditions for a unique equilibrium in the
clearinghouse access decision problem.
Prediction 1. A downward shift of the
clearinghouse access cost curve increases the equilibrium share of
informed consumers, \(\mu^{\ast}\).
The equilibrium share of informed consumers, \(\mu^{\ast}\), is where the clearinghouse
access cost of the marginal consumer equals the VOI. It is easy to see
that the lower the clearinghouse access costs, the higher is the
equilibrium share of informed consumers.
Next, we denote the ex ante (i.e., pre-MPD) share of informed
consumers by \(\mu_0\). The smaller the
slope of the VOI, the smaller is the increase in \(\mu^{\ast}\) for a given downward shift of
the clearinghouse access cost
curve.For
\(\hat{\mu} < \mu_0\), the slope of
the VOI is negative, making the curve steeper the smaller the slope
is.
Furthermore, if the ex ante share of informed consumers is greater
than \(\hat{\mu}\), any downward shift
in the clearinghouse access cost curve leads to a reduction in the VOI.
Although a sufficiently large downward shift in the clearinghouse access
cost curve could lead to a reduction in the VOI even if \(\hat{\mu}> \mu_0\), observing a decrease
in the VOI after MPD suggests that \(\hat{\mu}<\mu_0\). As we show in Section
4, the VOI decreases after MPD,
which is why we focus on predictions when \(\hat{\mu}<\mu_0\) from here onward.
Prediction 2. If \(\hat{\mu}<\mu_0\), a marginal downward
shift of the clearinghouse access cost curve decreases the VOI.
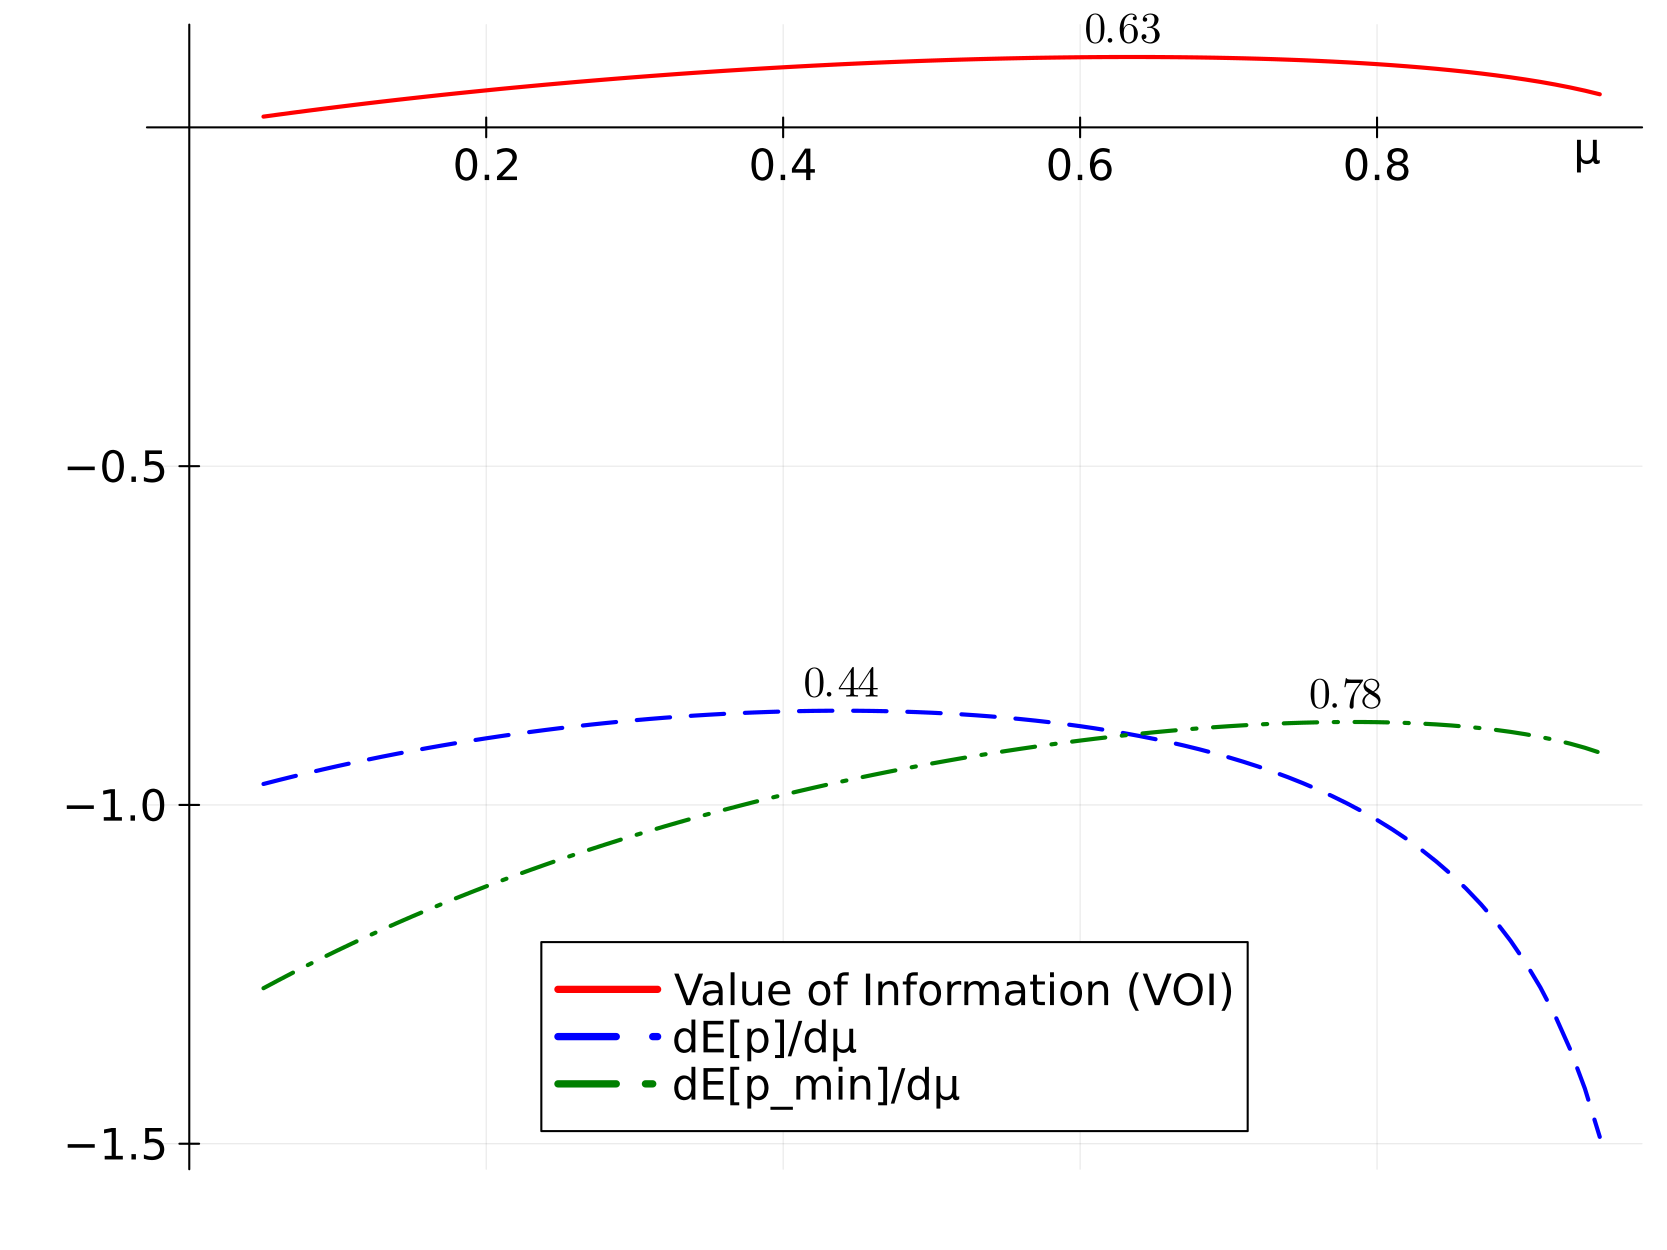
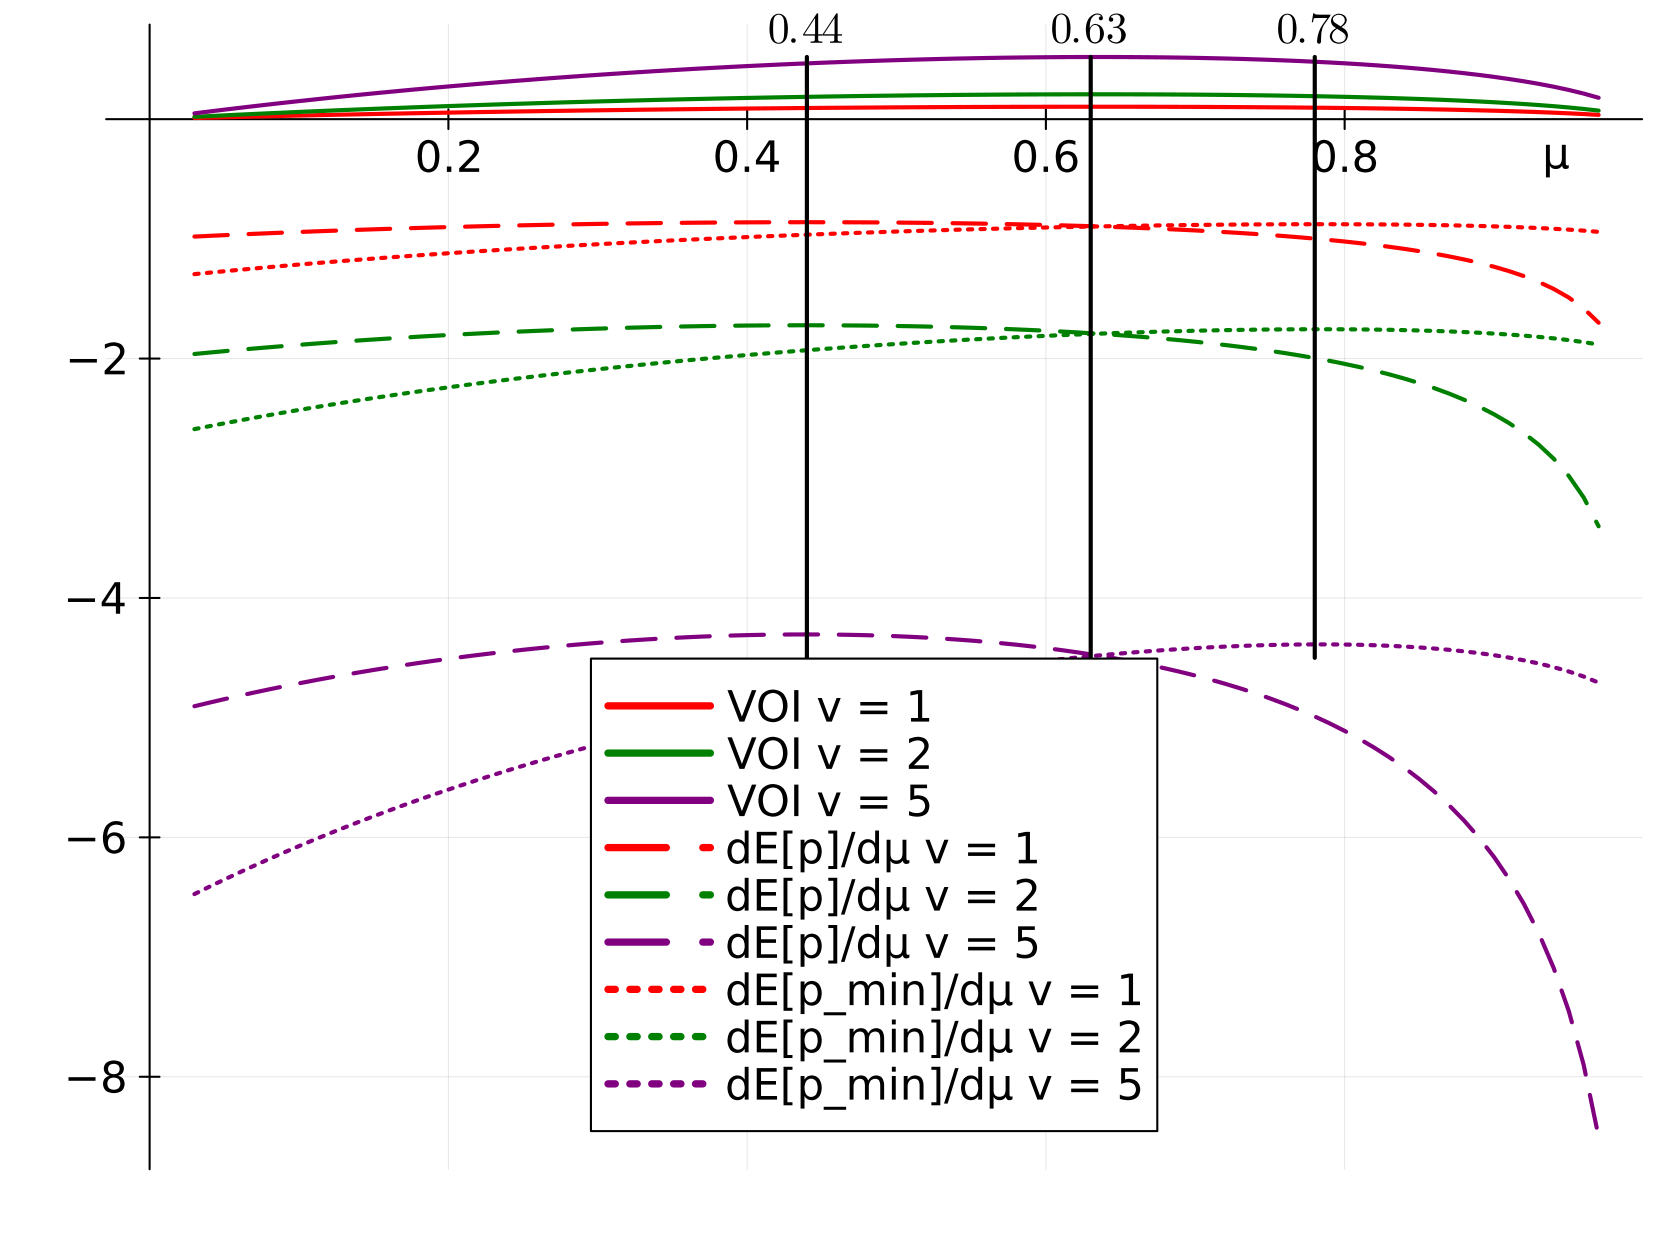
A. \(N = 2\)
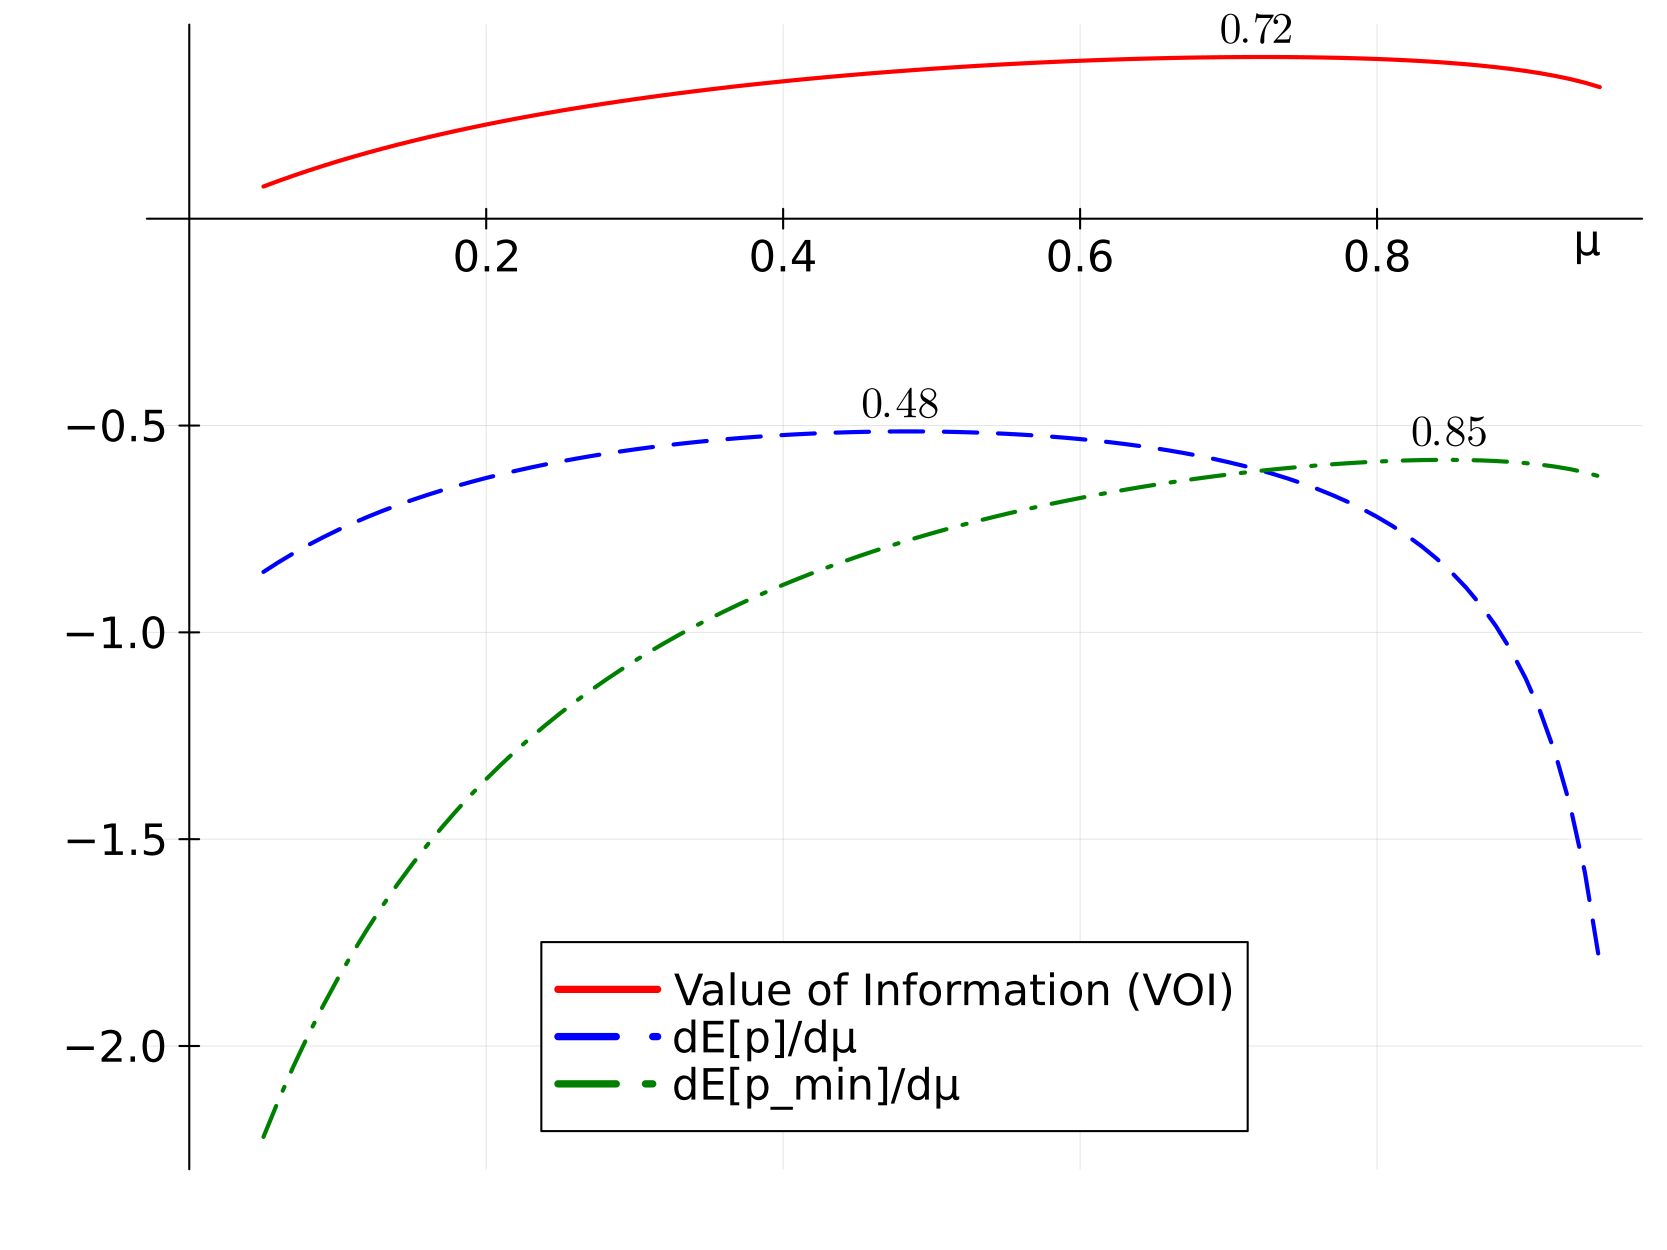
B. \(N = 5\)
Notes: The figure shows simulations of the VOI and the
change in \(E[p]\) and \(E[p_{min}]\) for a marginal increase in
\(\mu\) by the share of informed
consumers. We use \(\upsilon = 1\) in
all simulations. Panel A uses \(N =
2\), and Panel B uses \(N = 5\).
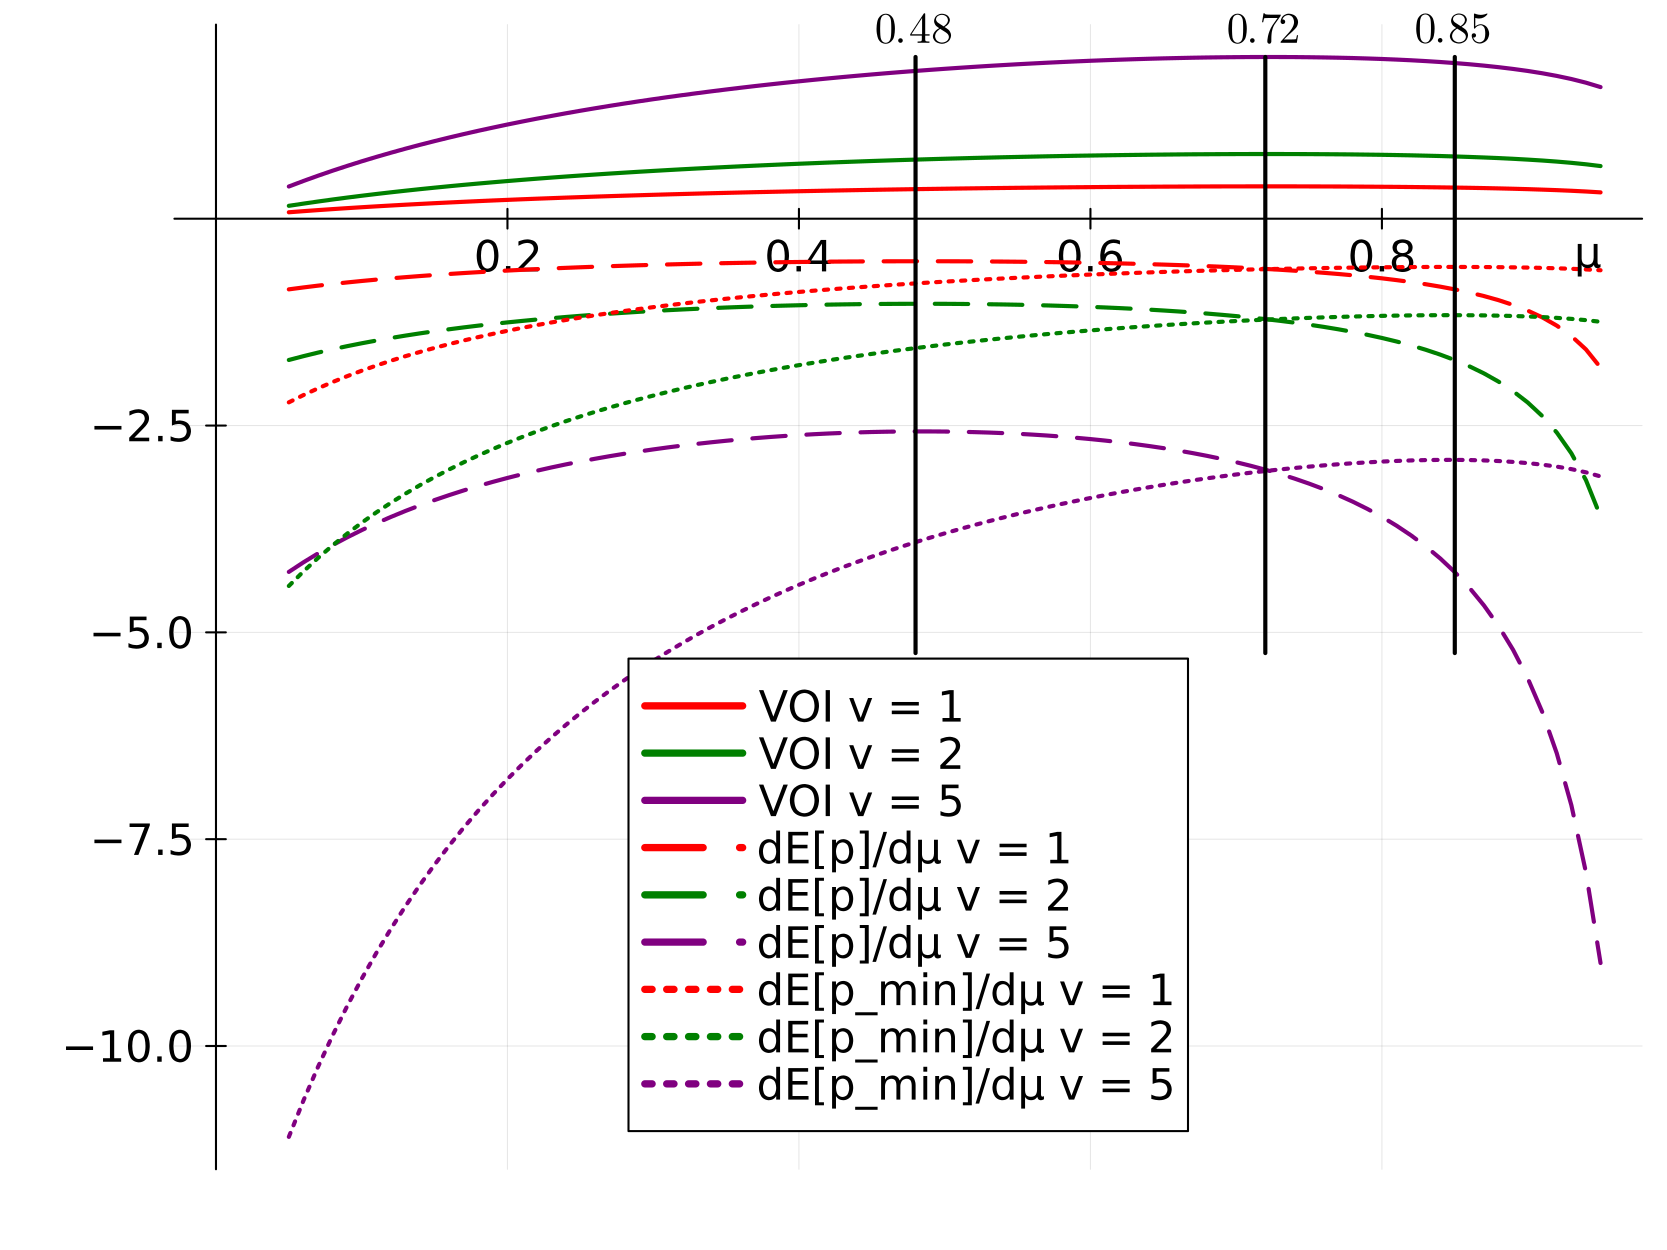
Appendix Figure A2 shows that the share of informed consumers maximizing
the VOI and the partial derivatives of \(E[p]\) and \(E[p_{min}\) with respect to \(\mu\) are independent of \(\upsilon\) and increase in \(N\).
Figure 2: VOI and marginal price effect by
share of informed consumers
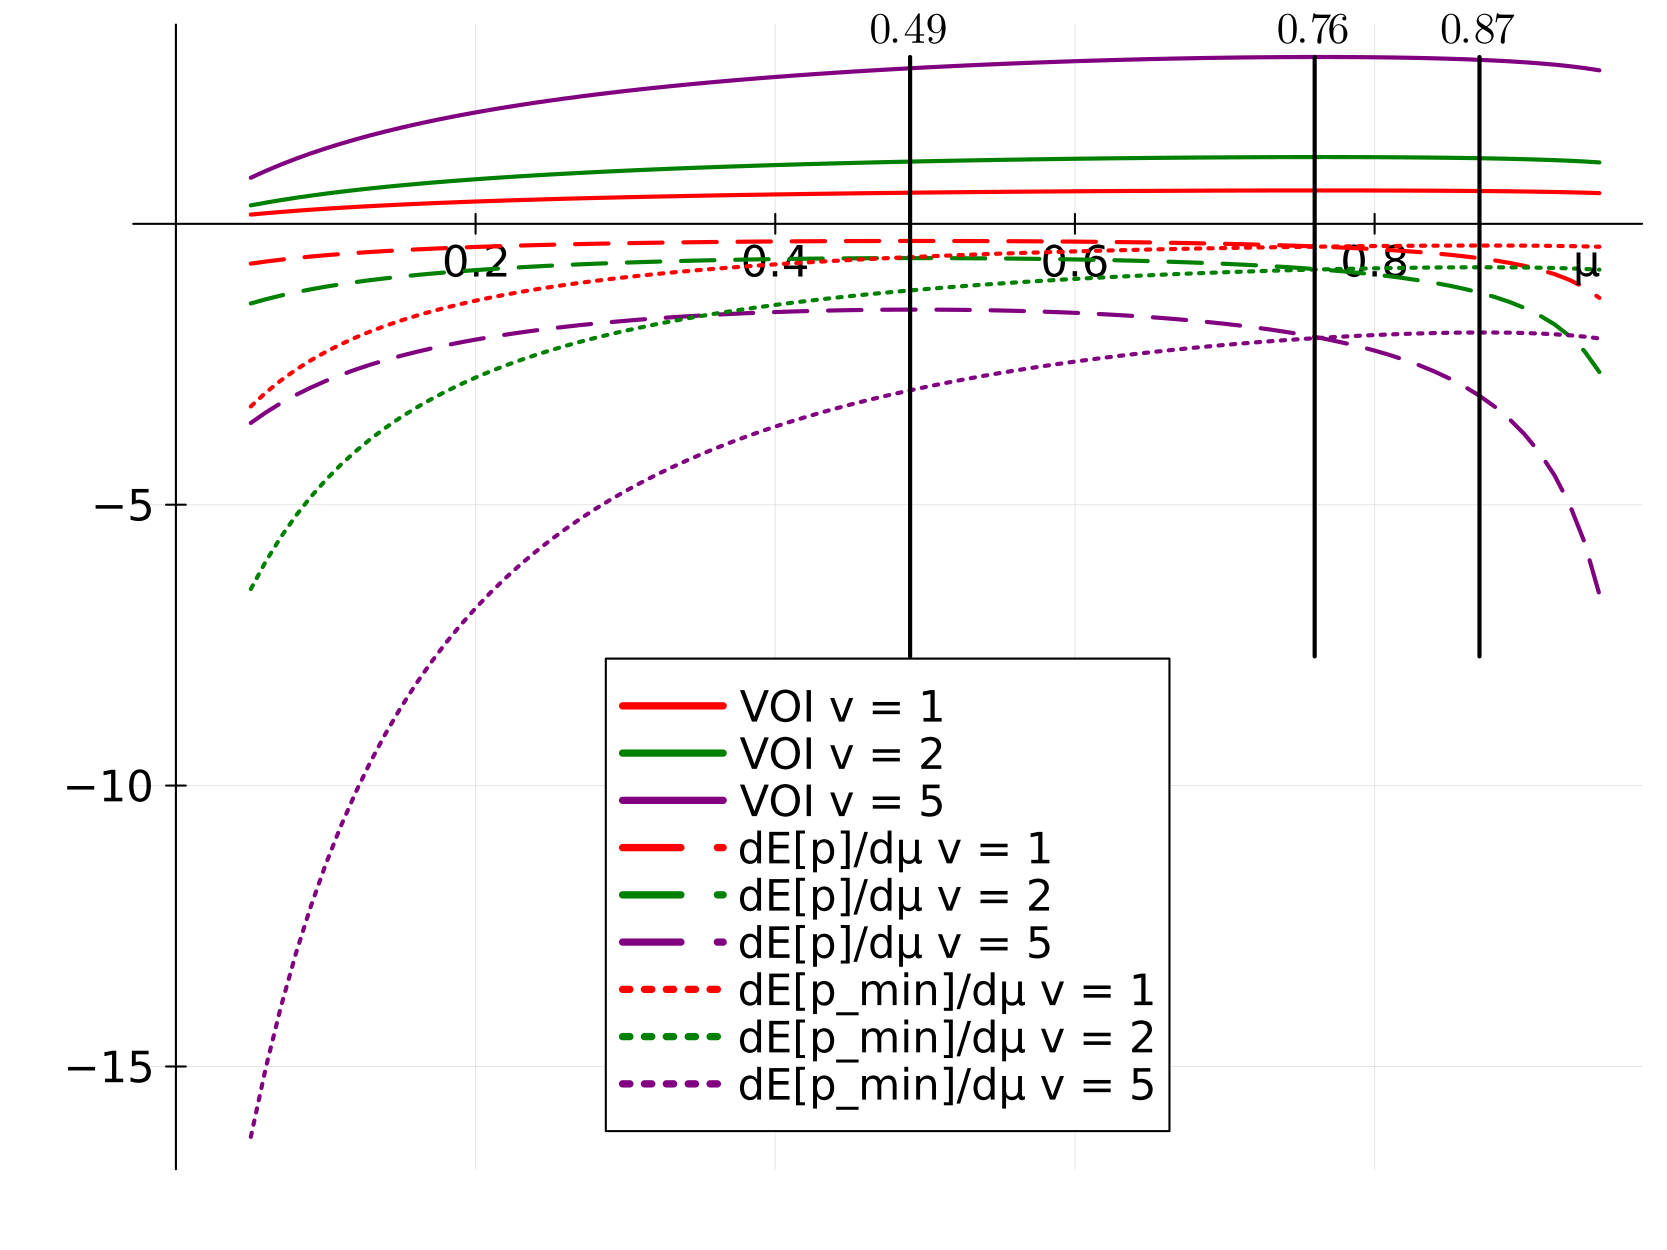
Figure 2 plots the VOI and the effect
on prices of marginally increasing the share of informed consumers by
the share of ex ante informed consumers. As we show in Appendix Figure
A2 , the share of informed consumers maximizing the marginal price
effect curves is independent of \(\upsilon\) and increases in \(N\).
An increase in the share of informed consumers always decreases the
expected price and the expected minimum price. Furthermore, if \(\mu_0\) is greater than \(\hat{\mu}\), a marginal increase in \(\mu\) decreases \(E[p]\) more the higher is \(\mu_0\). Finally, if \(\hat{\mu}<\mu_0\), a marginal increase
in \(\mu\) decreases the VOI more the
higher is \(\mu_0\).
Since a lower \(\mu_0\) leads to a
higher price decrease because it results in a larger change in \(\mu\) but also lowers prices less for a
given change in \(\mu\), a higher \(\mu_0\) can either increase or decrease the
price effect of MPD.
Another implication from Figure 2 is
that if \(\mu_0\) is greater than \(\hat{\mu}\), a given downward shift of the
clearinghouse access cost curve should decrease \(E[p]\) more than \(E[p_{min}]\). We can test this prediction
empirically without observing \(\mu\)
because we can compare \(E[p]\) and
\(E[p_{min}]\) in the same market,
i.e., for the same change in \(\mu\).
Prediction 3. If \(\hat{\mu}<\mu_0\), a marginal downward
shift of the clearinghouse access cost curve decreases \(E[p]\) more than \(E[p_{min}]\).
Next, we turn our attention to how the number of sellers mediates the
effect of MPD on prices. As becomes immediately clear and is shown by
Tappata (2009), a
higher number of sellers increases the VOI, and so for a given
distribution of clearinghouse access costs, a higher \(N\) increases the equilibrium share of
informed consumers.
Understanding the way \(N\) affects
how a marginal downward shift in the clearinghouse access costs changes
the equilibrium share of informed consumers is more complicated.
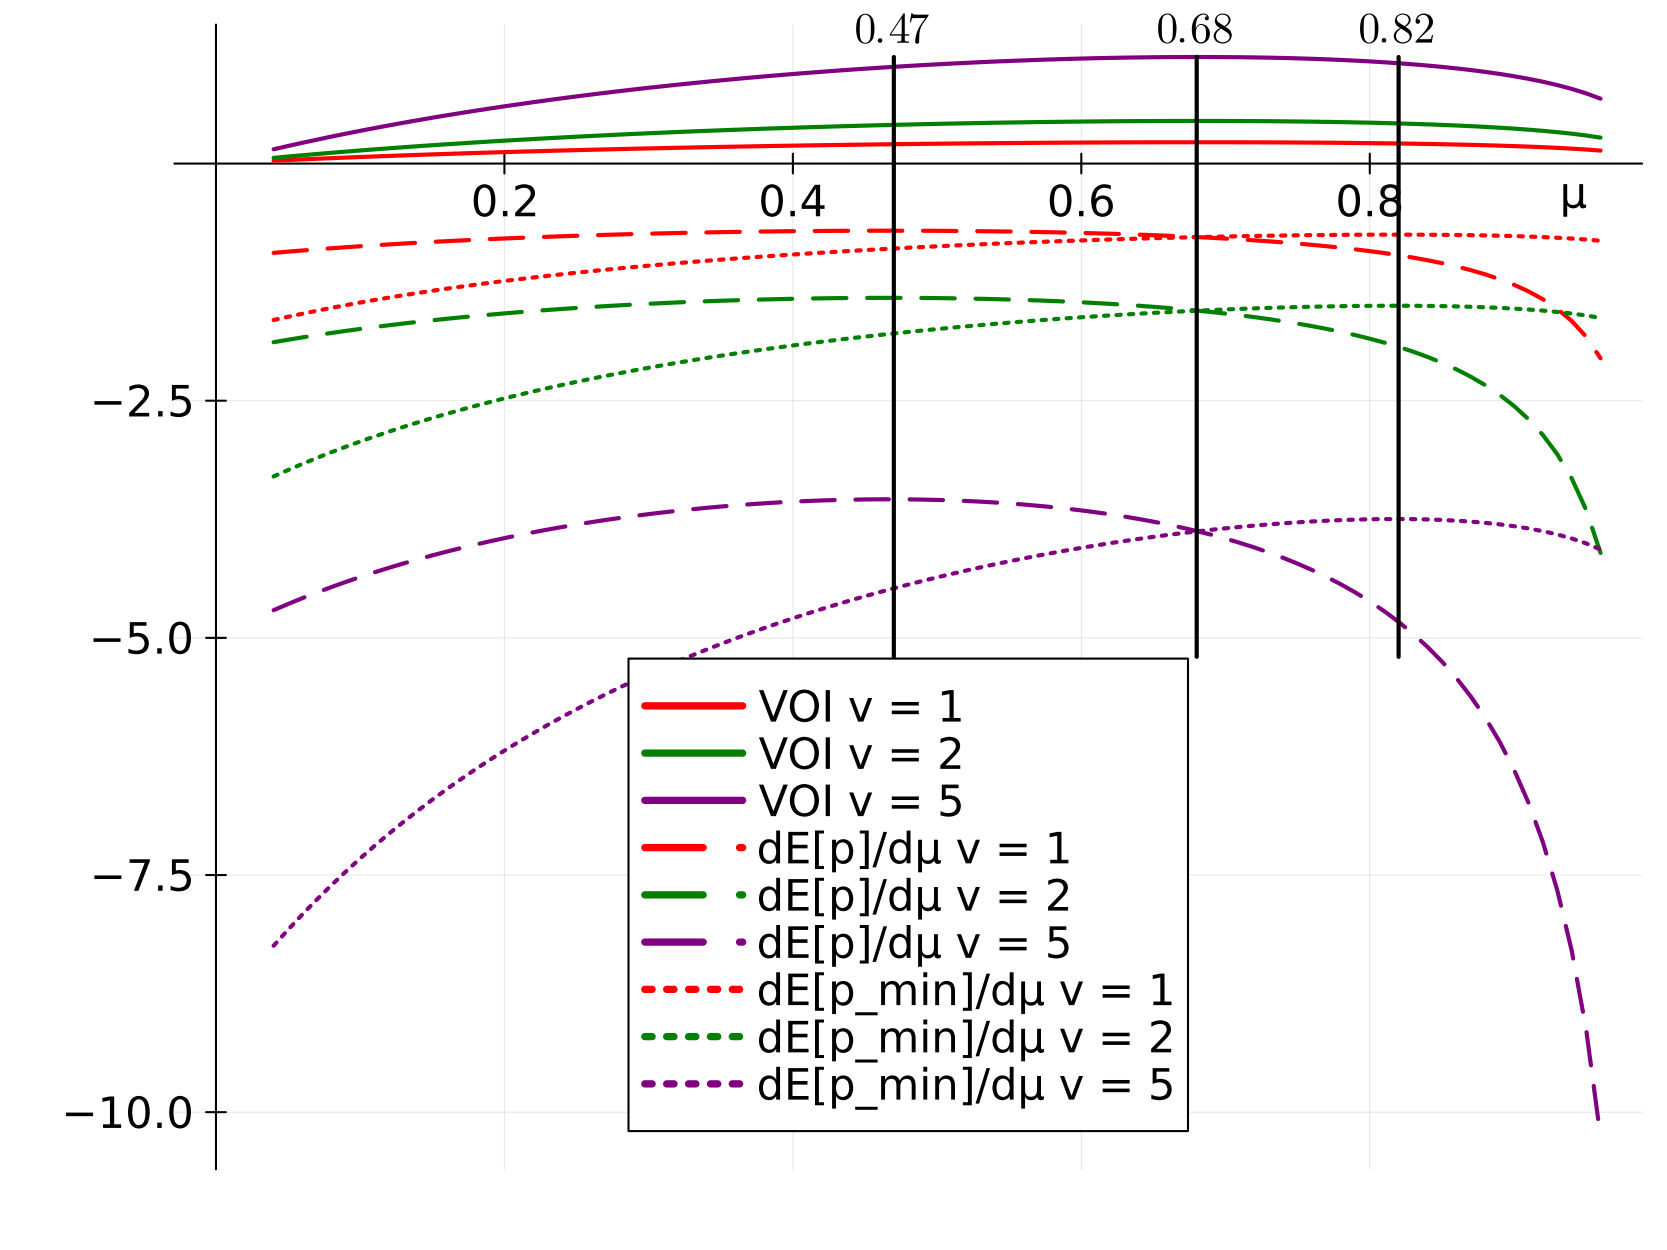
Appendix Figure A1 shows that the VOI curves become steeper the higher
is the number of sellers. A higher \(N\) therefore means that a downward shift
in the clearinghouse access costs increases the equilibrium share of
informed consumers more.
Figure A2 shows that the higher the number of sellers, the smaller is
the decrease in \(E[p]\) and \(E[p_{min}]\) resulting from a marginal
increase in \(\mu\).
Since we cannot observe the change in \(\mu\) resulting from MPD, we can estimate
only how the the price effect of MPD varies with the number of sellers.
The presence of more sellers leads to a larger increase in \(\mu\), which leads to a stronger decrease
in prices. At the same time, the presence of more sellers leads to a
smaller price decrease resulting from a marginal increase in \(\mu\). The price effect of \(MPD\) could therefore be increasing or
decreasing in the number of sellers.
Thus far, we have discussed only a marginal decrease in clearinghouse
access costs. Depending on how the MPD policy is designed, it can lead
to a more-than-marginal shift in the clearinghouse access cost
distribution. It is straightforward to see from Figure 1 that a larger downward
shift in the clearinghouse access cost curve leads to a larger increase
in the equilibrium share of informed consumers.
Prediction 4. The more mandatory price
disclosure decreases clearinghouse access costs for all consumers, the
more it increases \(\mu^{\ast}\) and
decreases prices.
Mapping predictions to
empirics
The simulation-based predictions highlight how MPD, represented by a
downward shift of the clearinghouse access cost curve, affects prices
and how this price effect is mediated by the ex ante share of informed
consumers and the number of sellers.
Prediction 1 suggests that the lower the
clearinghouse access cost curve, the higher is the equilibrium share of
informed consumers. Although our data do not allow us to estimate the
change in the share of informed consumers induced by MPD, we can
estimate the relative share of informed consumers between fuel types,
where consumers of gasoline and diesel differ in their clearinghouse
access costs.
Prediction 2 suggests that the
change in the VOI after MPD reveals whether \(\mu_0\) is smaller or larger than \(\hat{\mu}\). Since we can estimate the
market-level VOI before and after MPD, we can assess whether \(\mu_0\) is smaller or larger than \(\hat{\mu}\).
Once we have this result in hand, Prediction 3 hypothesizes a
differential impact of MPD on \(E[p]\)
and \(E[p_{min}]\). We can test this
empirically by estimating the effect of MPD on the market-level average
price and minimum price in the empirical application.
According to Prediction 4, a greater reduction
in clearinghouse access costs leads to a larger price decrease. We test
this by studying local follow-on information treatments, which
presumably further reduce clearinghouse access costs.
Finally, while the model does not have clear predictions about
whether the price effect of MPD increases or decreases in \(\mu_0\) and \(N\), it reveals useful information about
the mechanism through which MPD affects prices.
Institutional Setting
In the empirical application, we study how mandatory price disclosure
affects equilibrium prices in the German retail fuel market.
The German retail fuel
market
Retail fuels are products with a very high degree of homogeneity
within their product category. Although fuel stations also sell other
products, we focus on fuel sales only.
The two main fuel products are diesel and gasoline. Consumers cannot
substitute between these without switching cars. In our analysis, we
focus on gasoline with an octane rating of 95 and an ethanol share of 5%
(also referred to as E5), as well as on diesel, which were used
in 56% and 29%, respectively, of passenger vehicles with combustion
engines in Germany in
2013.This
is based on 2013 statistics from Verkehr in Zahlen 2018 and
Bundesverband der deutschen Bioethanolwirtschaft
2013.
On the demand side, drivers of diesel passenger vehicles drove on
average twice as much (\(20,500\) vs
\(11,000\) kilometers per year,
Verkehr in Zahlen 2018) than drivers of gasoline passenger
vehicles during our observation period. Buying a diesel vehicle is
therefore considered a fixed cost investment to lower marginal costs.
Diesel vehicles tend to be more expensive than gasoline vehicles;
however, the per liter price for diesel fuel is consistently lower than
that for gasoline because taxes on diesel are lower. Drivers who expect
to drive longer distances can therefore self-select into paying more
upfront for a diesel vehicle to save on fuel costs later on. For the
same reason, on average, the returns to being informed are higher for
drivers of diesel than for drivers of gasoline vehicles.
One could still argue that since diesel vehicles are often used for
business purpose, diesel drivers may actually be less prone to search
for lower prices. This is unlikely to be a concern in our case. As of
January 2013, while \(12.6\) million
diesel passenger vehicles were in circulation in Germany, just \(4.6\) million vehicles, including both
those with gasoline and those with diesel engines, were in use for
commercial purpose. This means that at least \(63\)% of diesel vehicles are owned and
operated by private individuals ((Kraftfahrt-Bundesamt 2013)). Among the
remaining \(37\)% of diesel vehicles
used for business purposes, some drivers receive a lump-sum or a
per-mile fuel allowance or are self-employed, which creates additional
incentives to save on fuel costs. Thus, that many diesel vehicles are
used for commercial purposes does not invalidate our observation that
diesel drivers are on average more price sensitive than gasoline
drivers.In
Section 4, we provide further
descriptive evidence that suggests that diesel drivers were on average
more informed about fuel prices than gasoline drivers both before and
after MPD.
On the supply side, the retail fuel market in Germany is vertically
organized. In the upstream market, crude oil is refined into retail
products. These are sold and distributed to the downstream market, where
fuel stations sell the retail products to drivers. According to the
German Federal Cartel
Office (2011) (GFCO), concentration is high in both the upstream
and downstream markets. Furthermore, some firms are vertically
integrated, whereas others are not.
Mandatory price disclosure
Before the introduction of MPD, consumers were much less informed
about prices than sellers and hence found it difficult to assess the
competitiveness of a particular fuel price. In the absence of an
information clearinghouse, consumers faced significant search costs. To
learn the prices of all potential sellers, a driver would need to drive
to all
stations.Prior
to MPD, there were already some apps that allowed users to self-report
fuel prices, which were then collected and diffused to users in a
fashion similar to how price information is presented under MPD, but the
usage of these apps before MPD was considerably lower than after its
introduction.
A market investigation ending in 2011 led the GFCO to determine that
prices in regional fuel markets were higher than under functioning
competition. After the market investigation, the GFCO and the German
Monopolies Commission concluded that a lack of price transparency on the
consumer side caused the lack of competition and therefore called for an
increase in price transparency in the downstream market. In 2012, the
German parliament passed a law stipulating the creation of the market
transparency unit for petrol under the management of the GFCO, and on 12
September 2013, the MTU began operating. The MTU is an information
clearinghouse that collects prices in real time and allows app creators
to diffuse the information to users. It hence provides consumers access
to live price data and increases price transparency.
Data
Our core data set contains station-level prices for the universe of
fuel stations in Germany and France for the years 2013 and 2014. We
supplement this with consumer search data from a major app providing
fuel prices in Germany under MPD.
Prices,
retail margins and fuel station characteristics
Our primary data set contains station-level E5 gasoline and
diesel prices on weekdays at 5 pm between 12 April 2013 and 31 December
2014 in
Germany.We
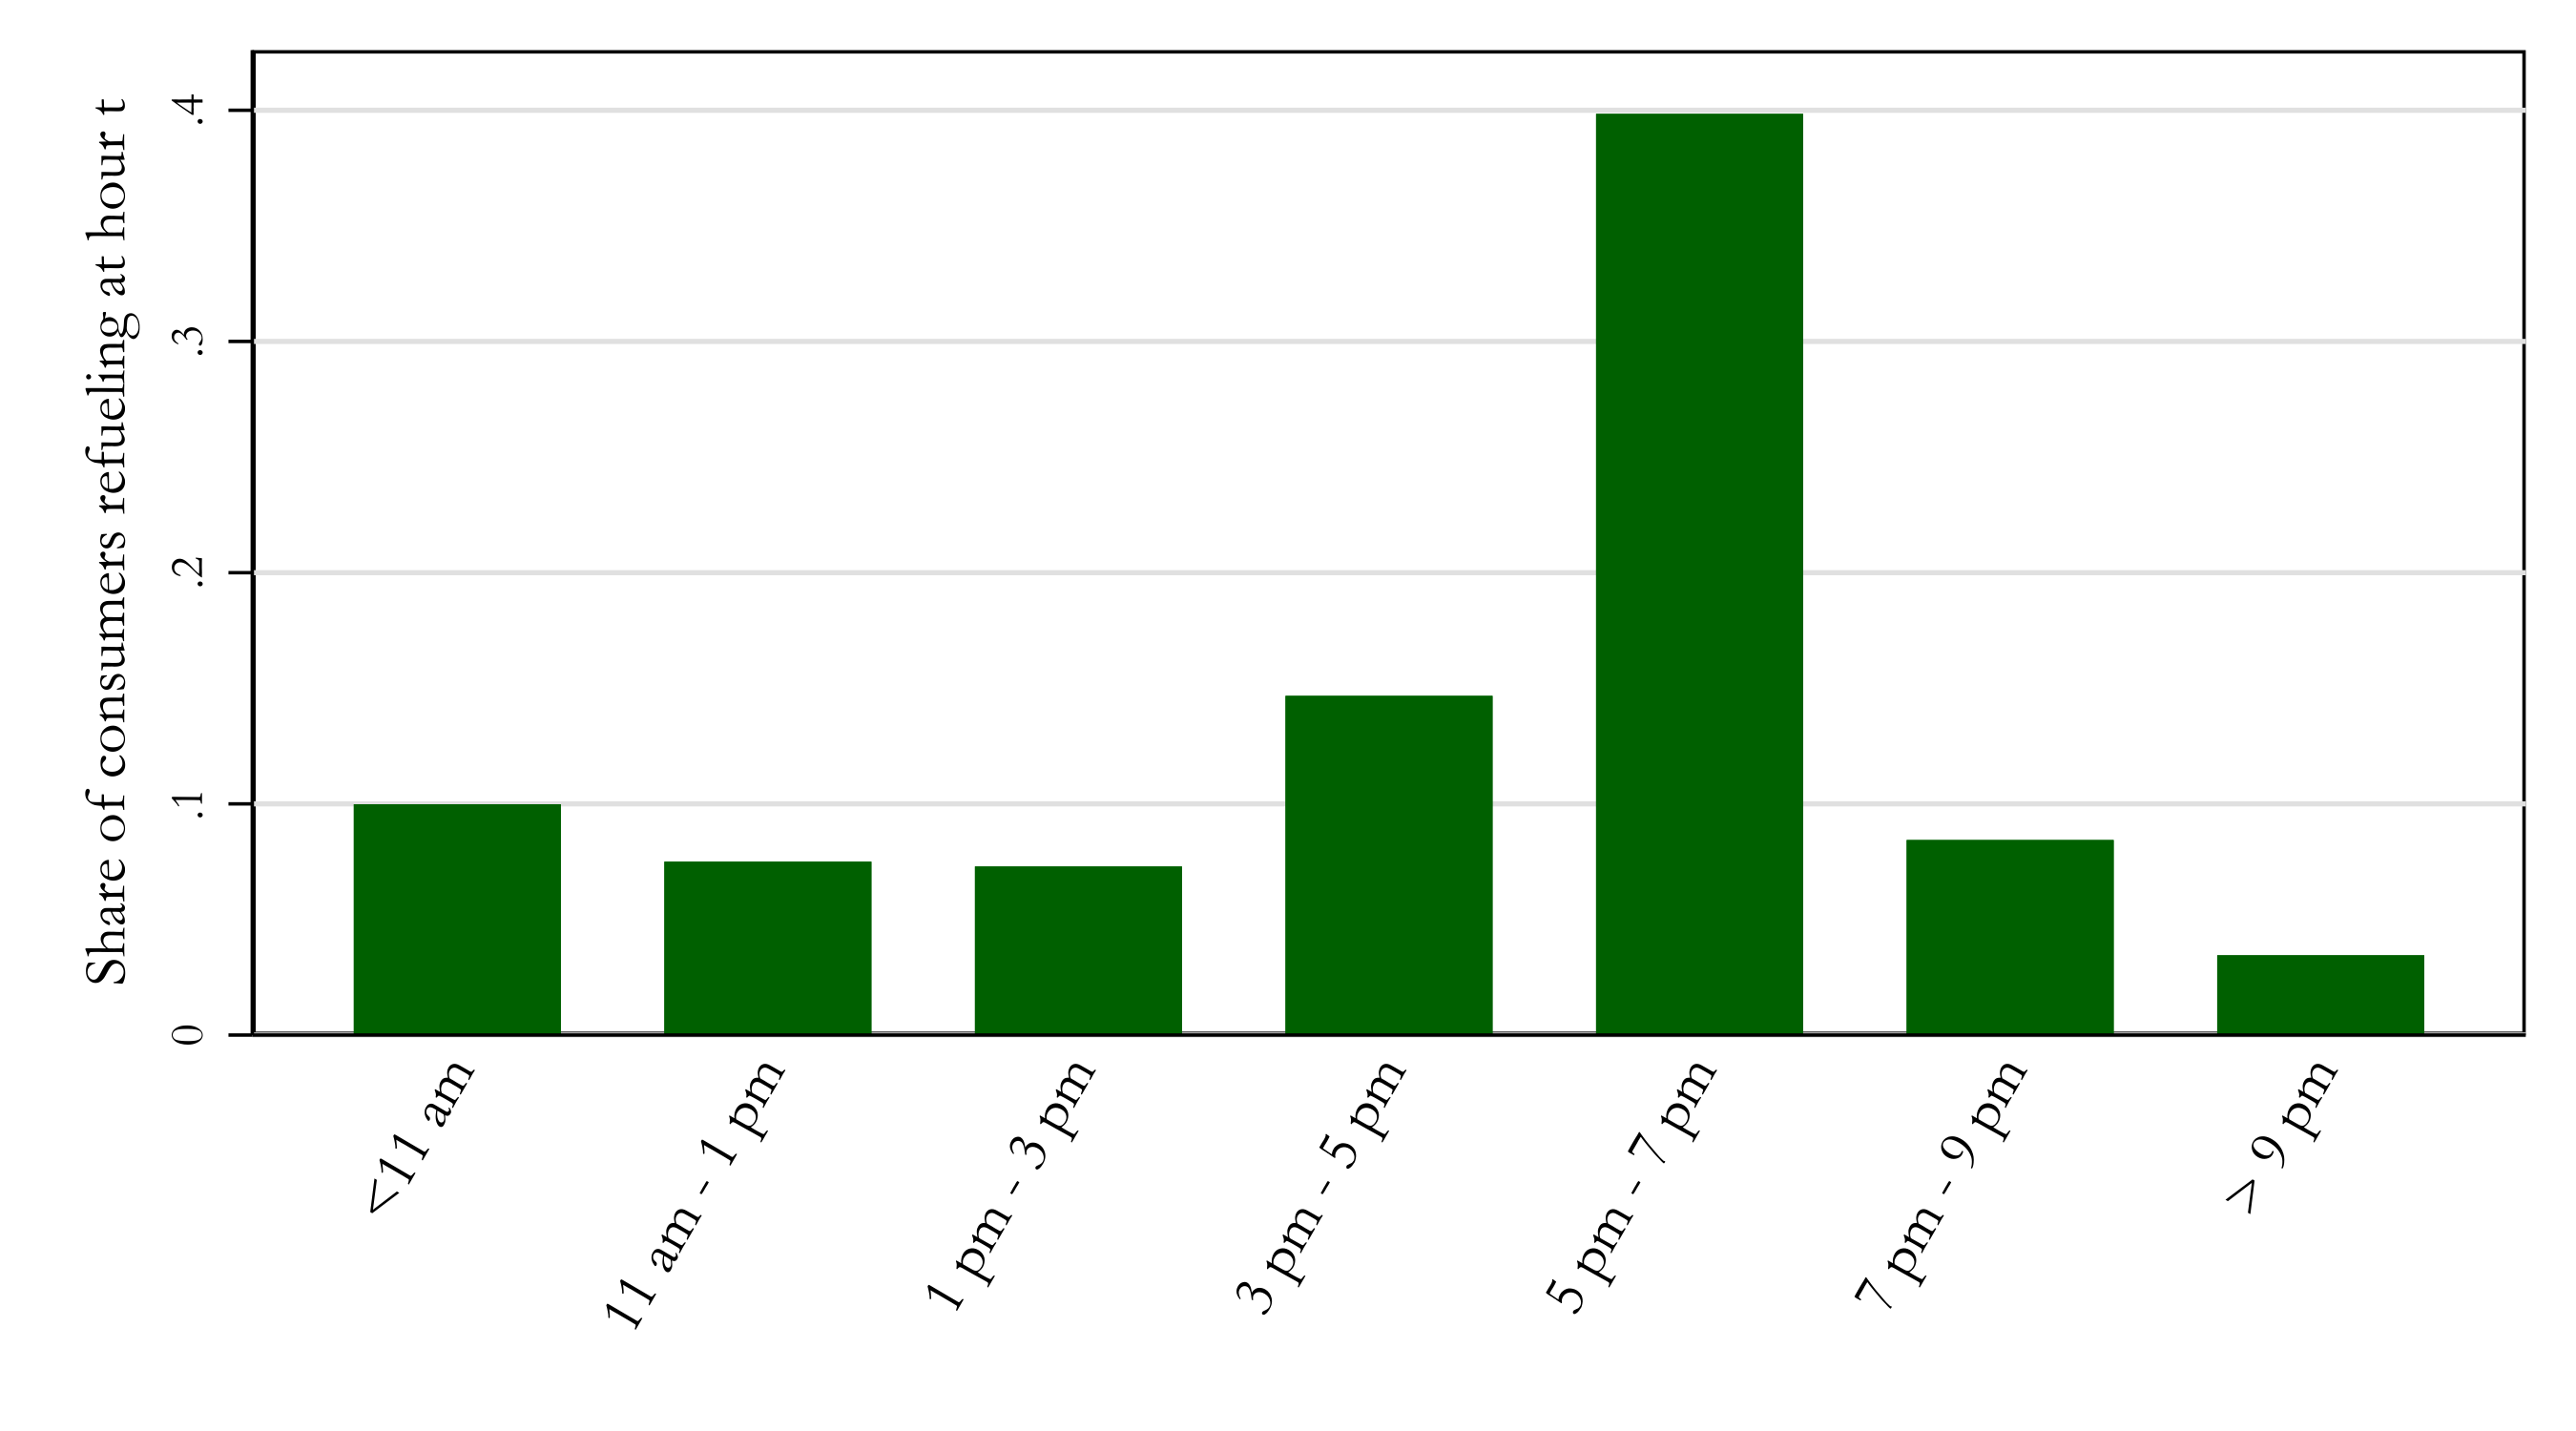
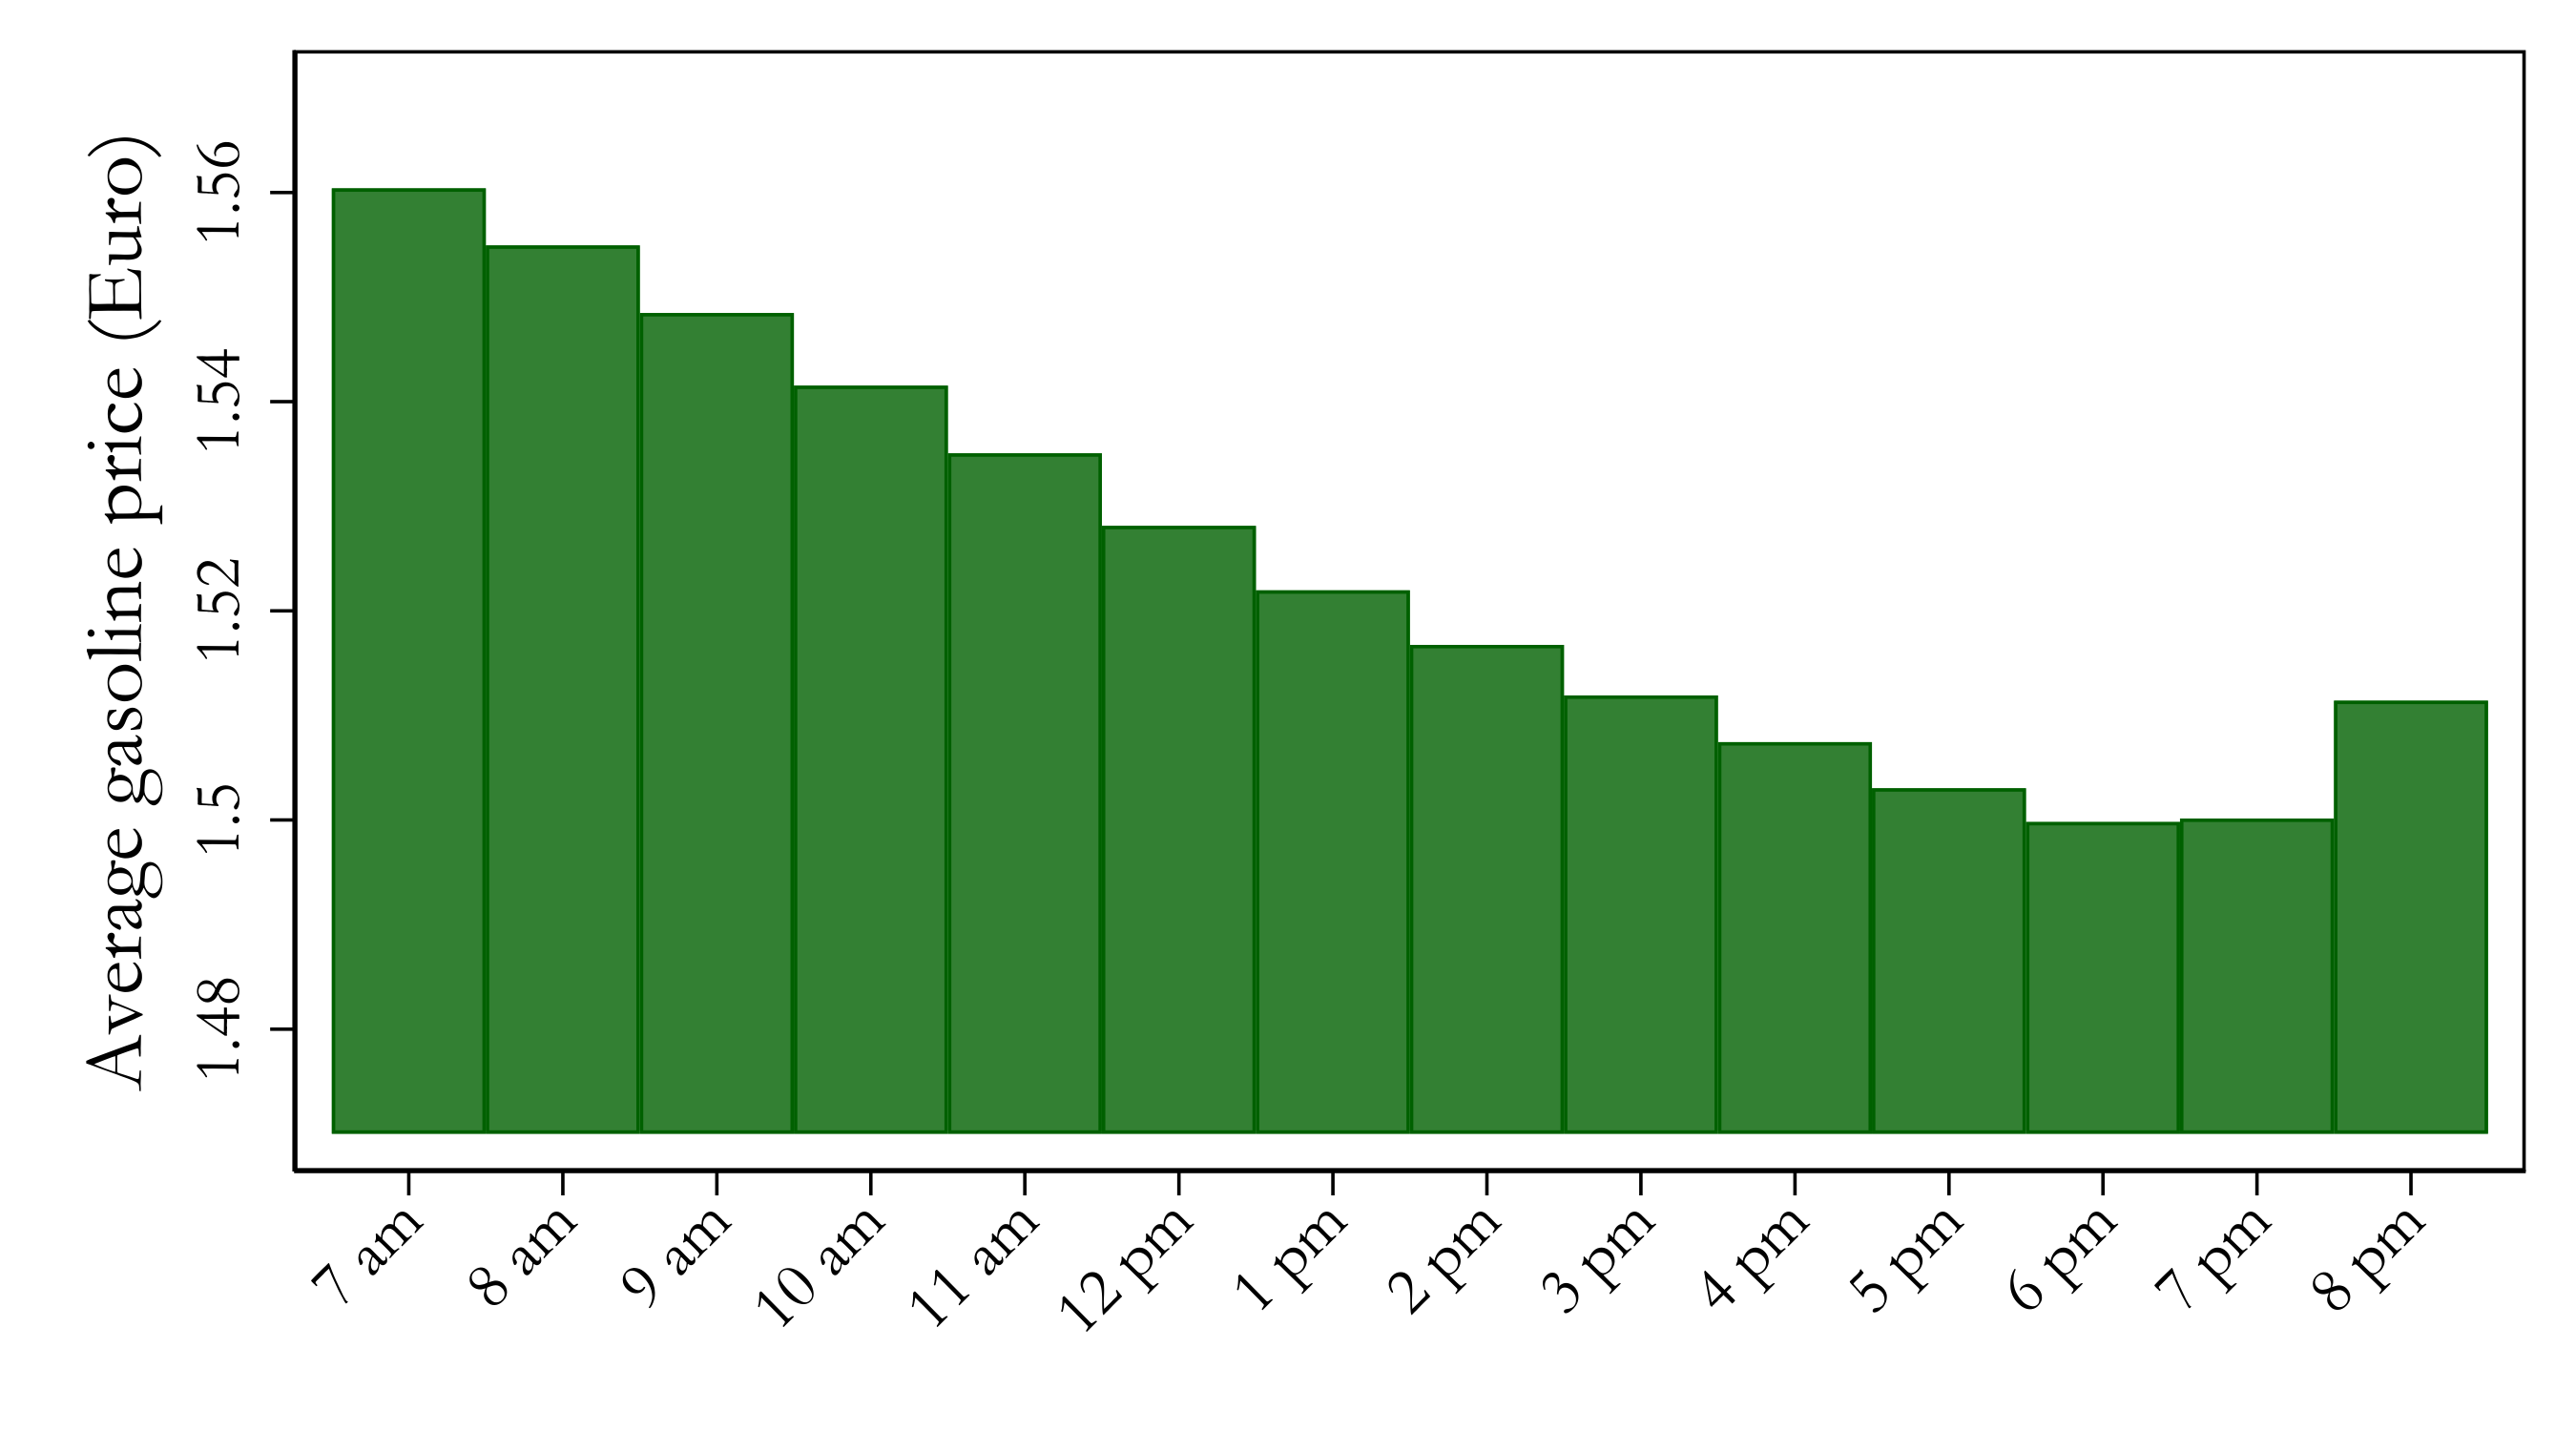
choose prices at 5 pm since this is the time around which most fuel is
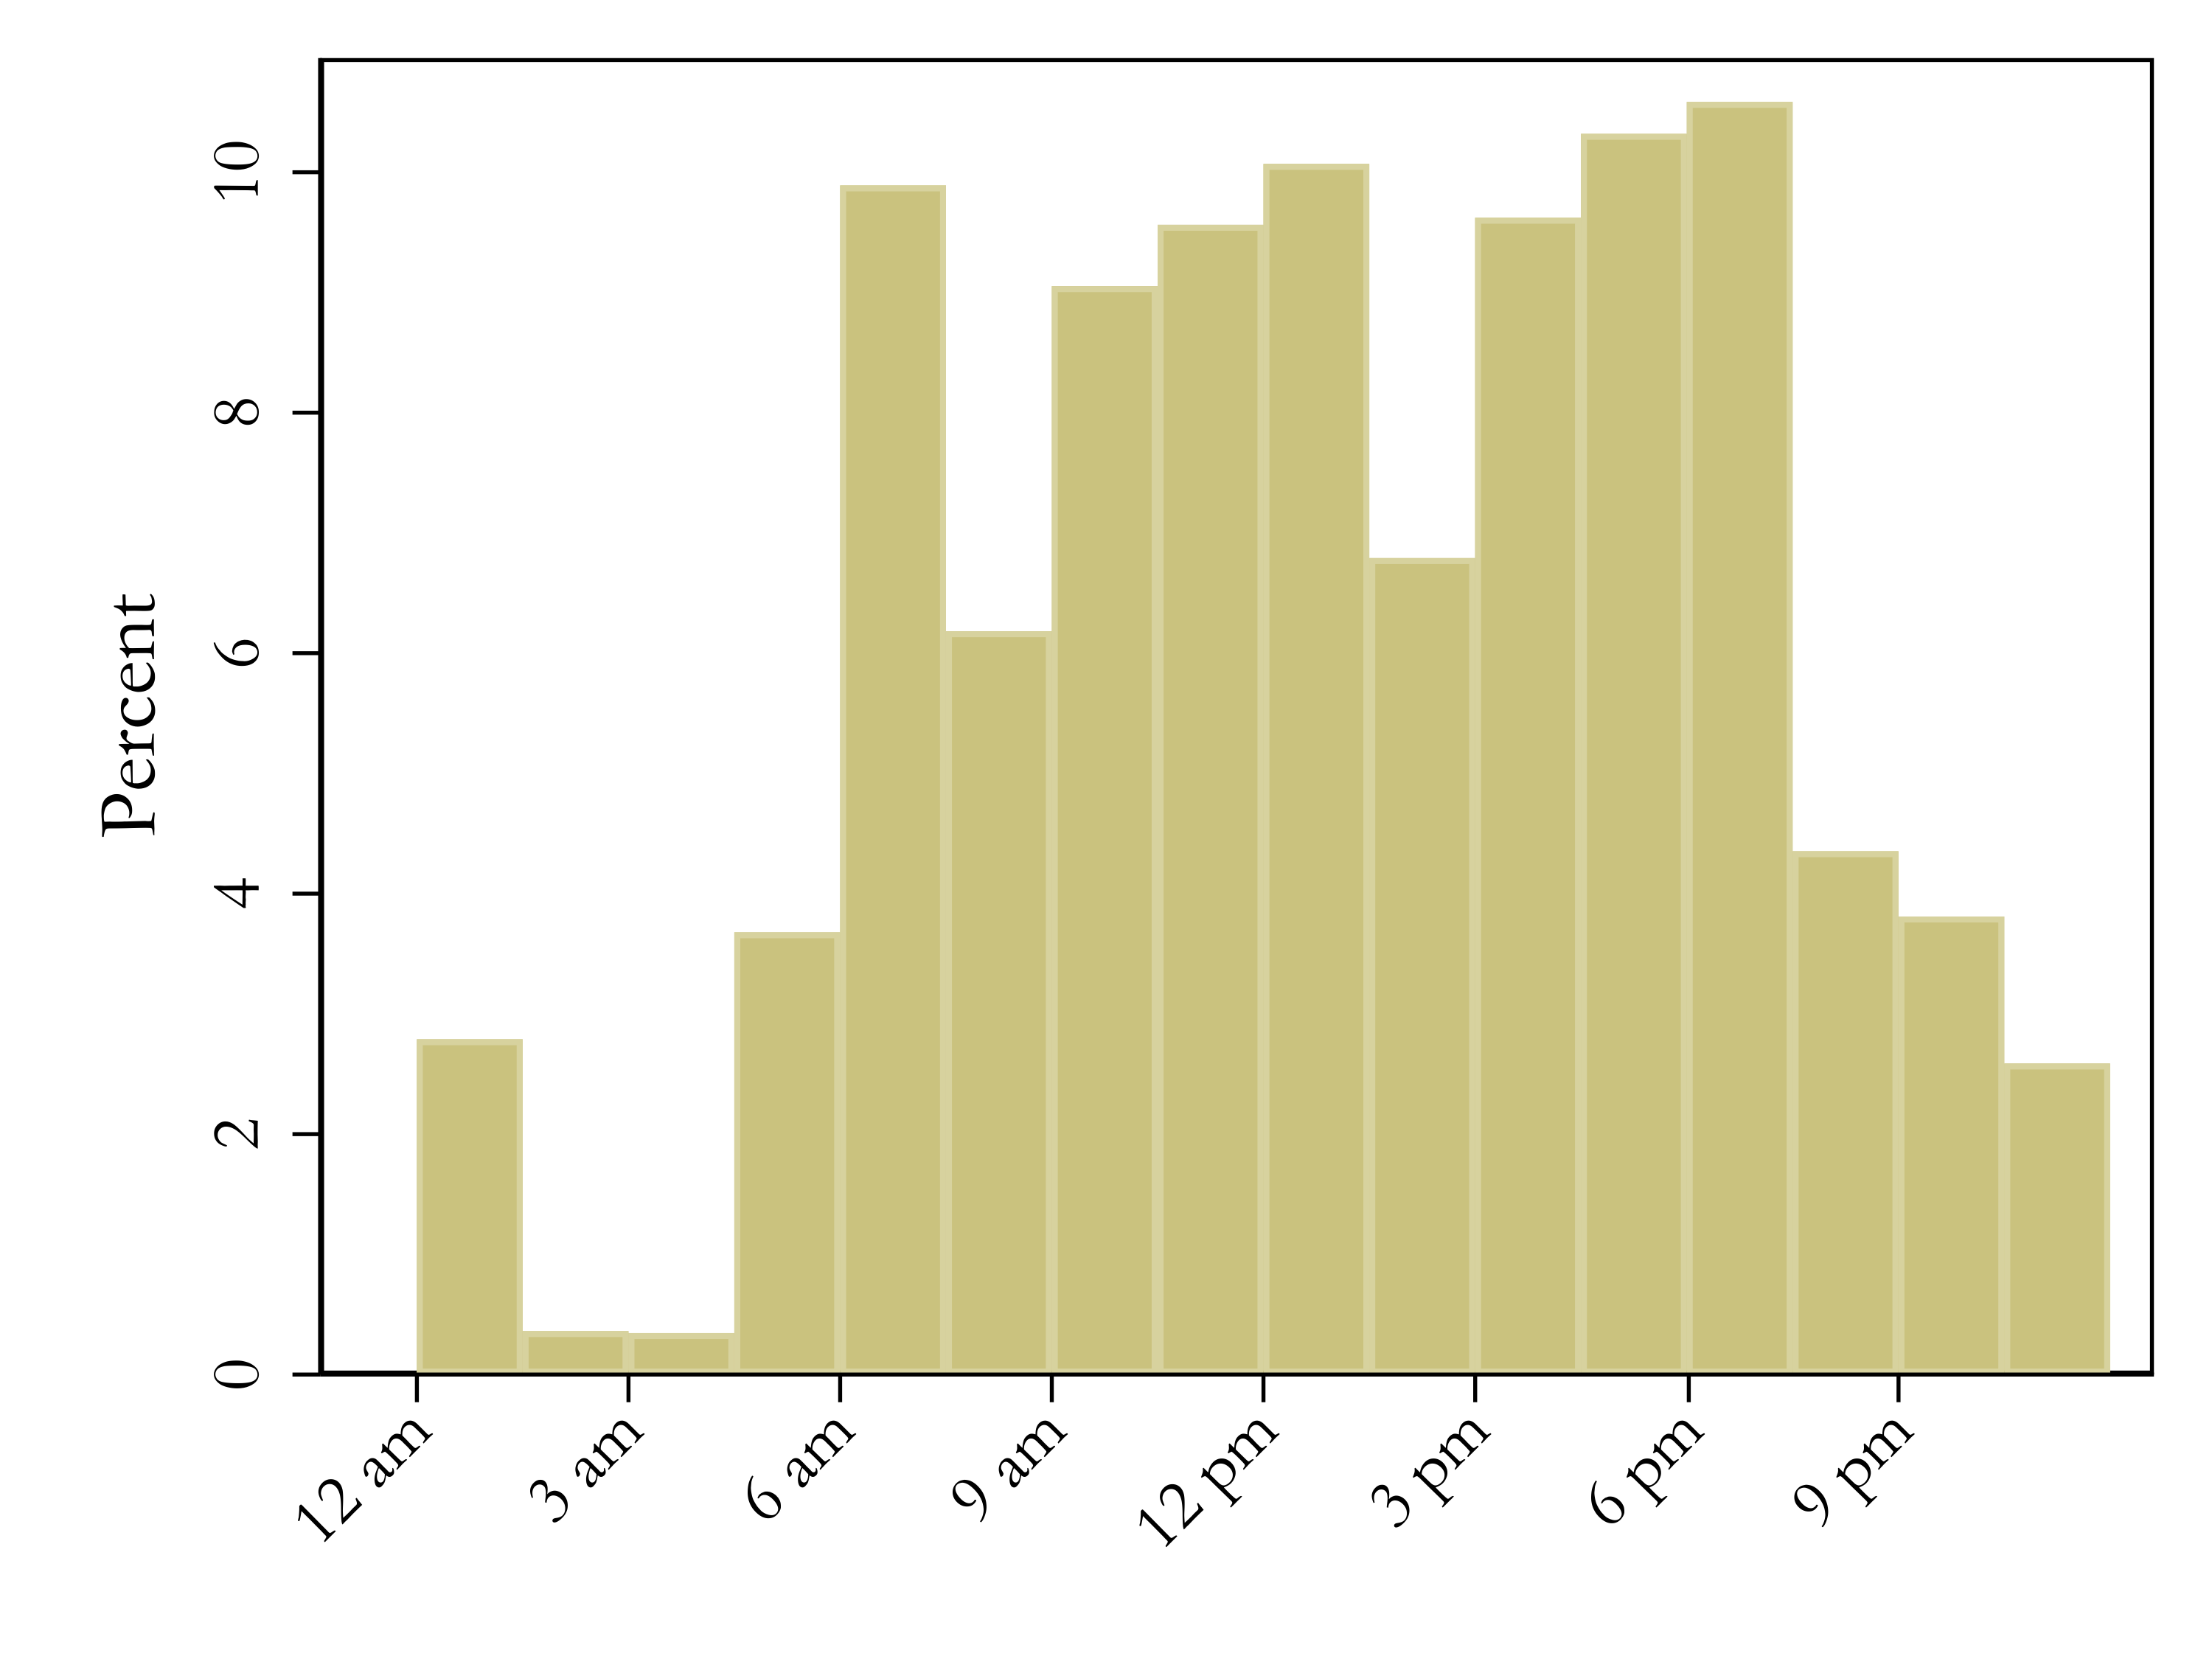
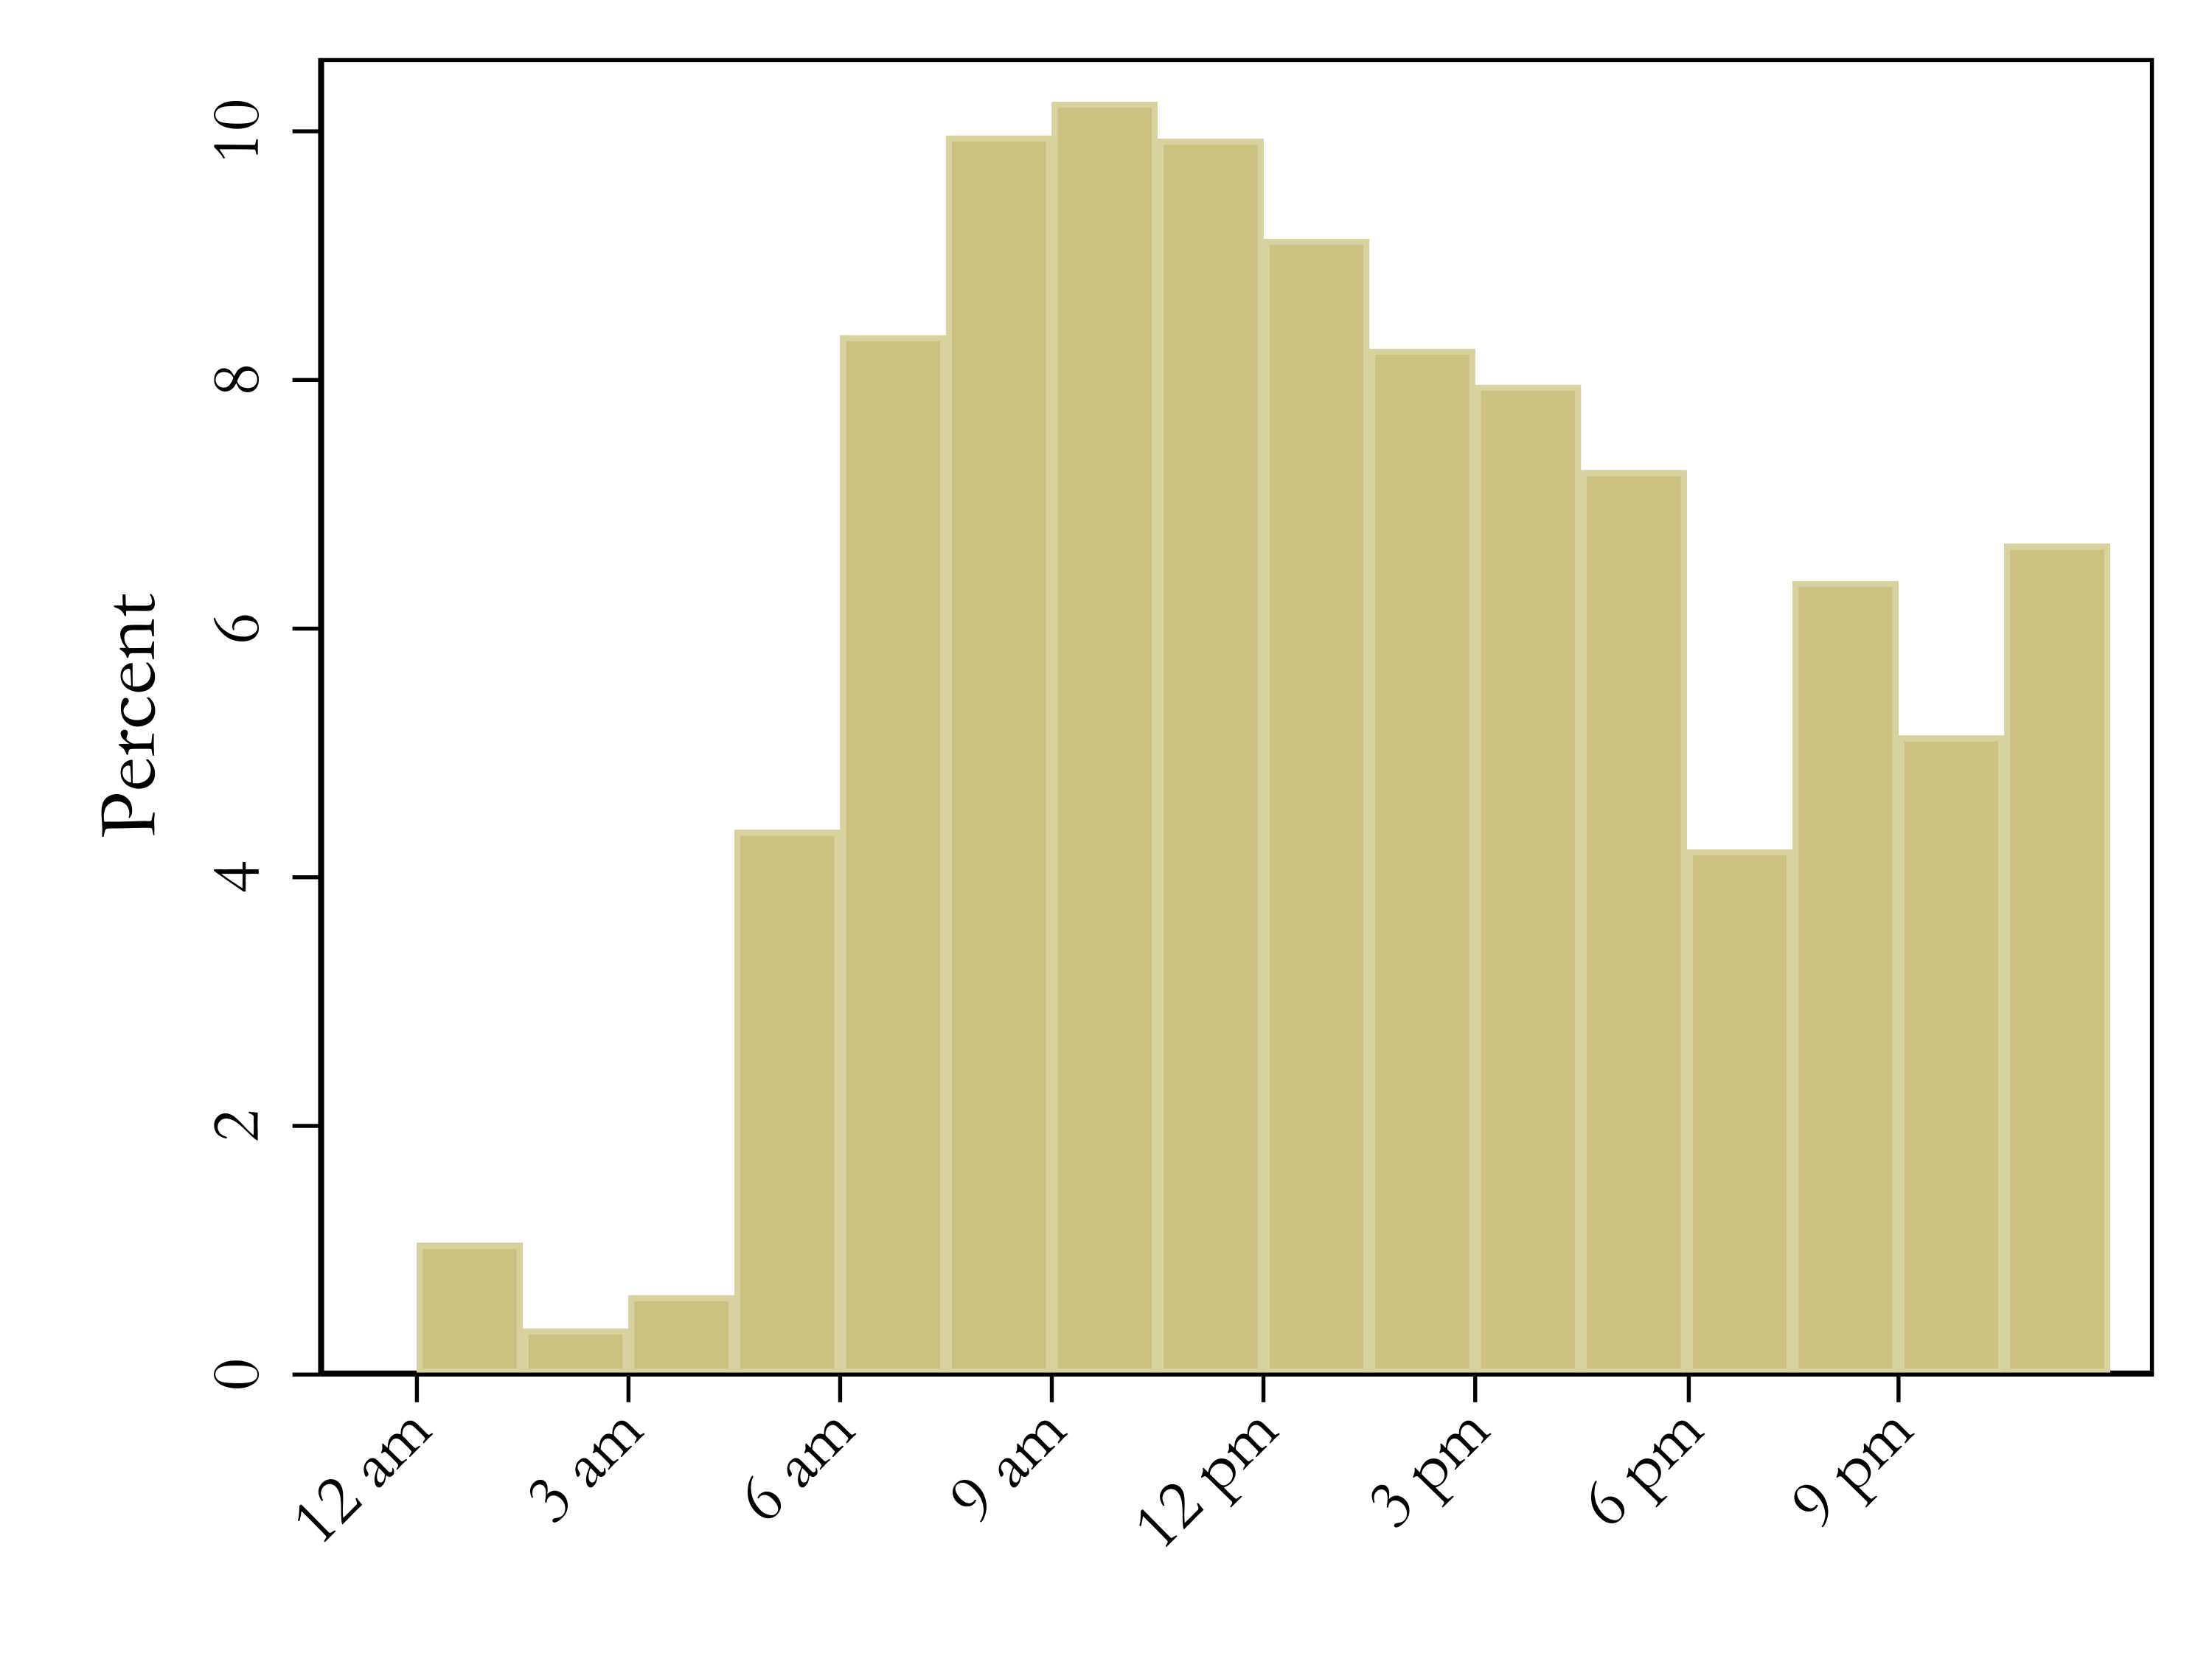
bought in Germany. More details on daily price cycles and purchase
patterns are included in Appendix B . Although the stylized model does
not feature price cycles, Cason et al. (2020) show for experimental
markets with features similar to those of the Varian (1980), Burdett and Judd (1983) and Stahl (1989) models that
the observed pricing patterns feature price cycles. After prices over
time are collapsed, the mixed strategy equilibrium distribution in the
theoretical search models does well at explaining the observed price
distribution. Throughout most of our analyses, we use the
station-level gross retail price, which includes taxes and duties, as an
outcome variable. To estimate heterogeneity in the treatment effect, we
add station characteristics such as information on the brand and address
to our data set.
To illustrate how MPD affects sellers, we carry out some analyses
using retail margins as an outcome variable. We compute retail margins
by subtracting the share of the price of crude oil that goes into the
production of diesel or gasoline from the net retail price using the
daily crude oil price at the port of
Rotterdam.For
a detailed description of the calculation of prices and margins, see
Appendix B .
A novel and unique feature of our data is that we have rich
station-level price information from before the introduction of
MPD. At that time, to the best of our knowledge, two smartphone apps
existed that allowed their users to self-report station-level fuel
prices. Although the usage of these apps was low in comparison to the
usage of the more than 40 apps available after the introduction of MPD
and the publicity that came with it, the pre-MPD apps contain rich price
information. We use price data for the pre-MPD period supplied by one of
the apps collecting self-reported prices. This data set comprises 17
million price reports for more than \(13,500\) stations between 1 January and 12
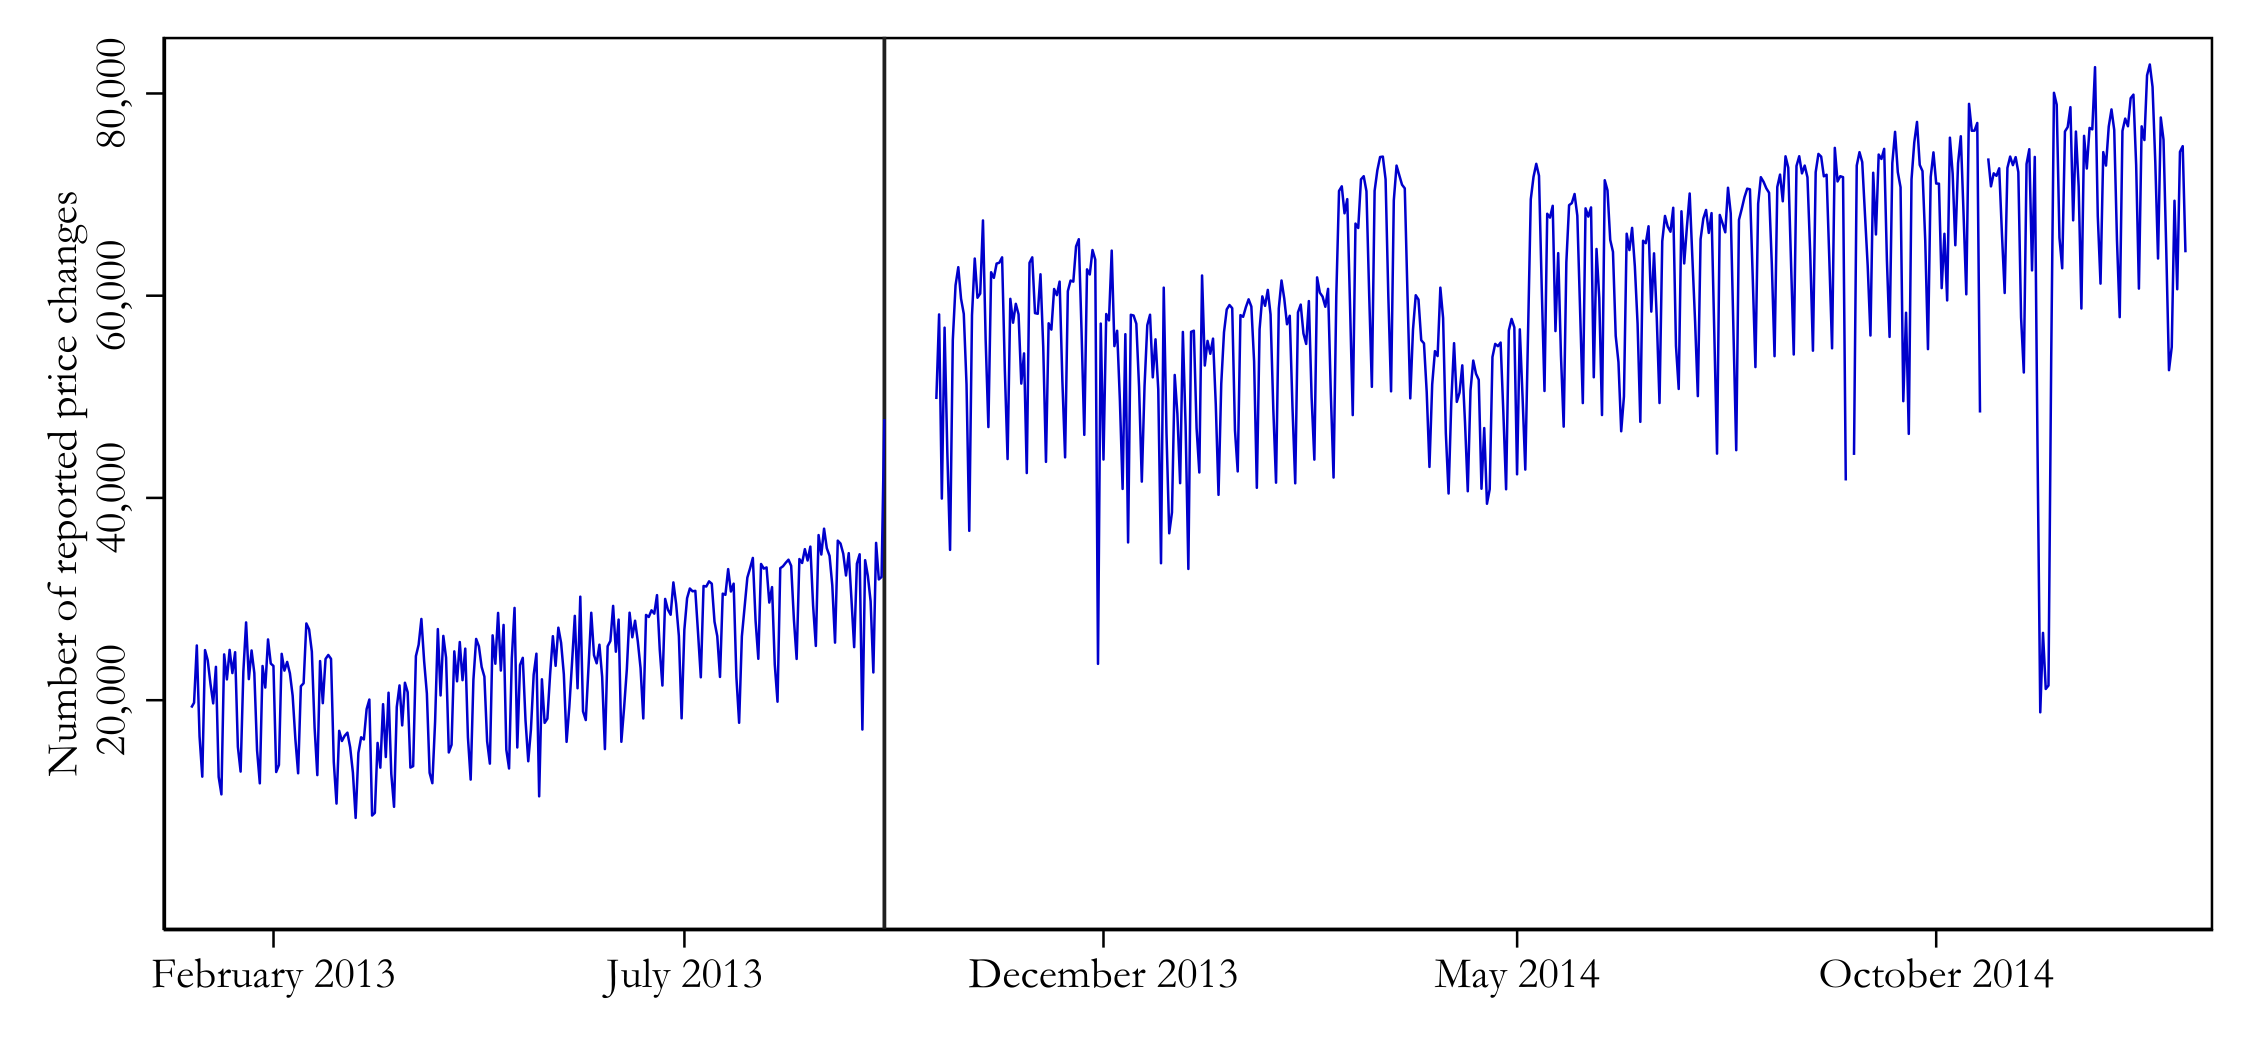
September 2013. Although the MTU started operations on 12 September
2013, we have access only to its data from 1 October 2013 onward. Since
our self-reported pre-MPD data only run until 12 September 2013, the
period in between is not analyzed.
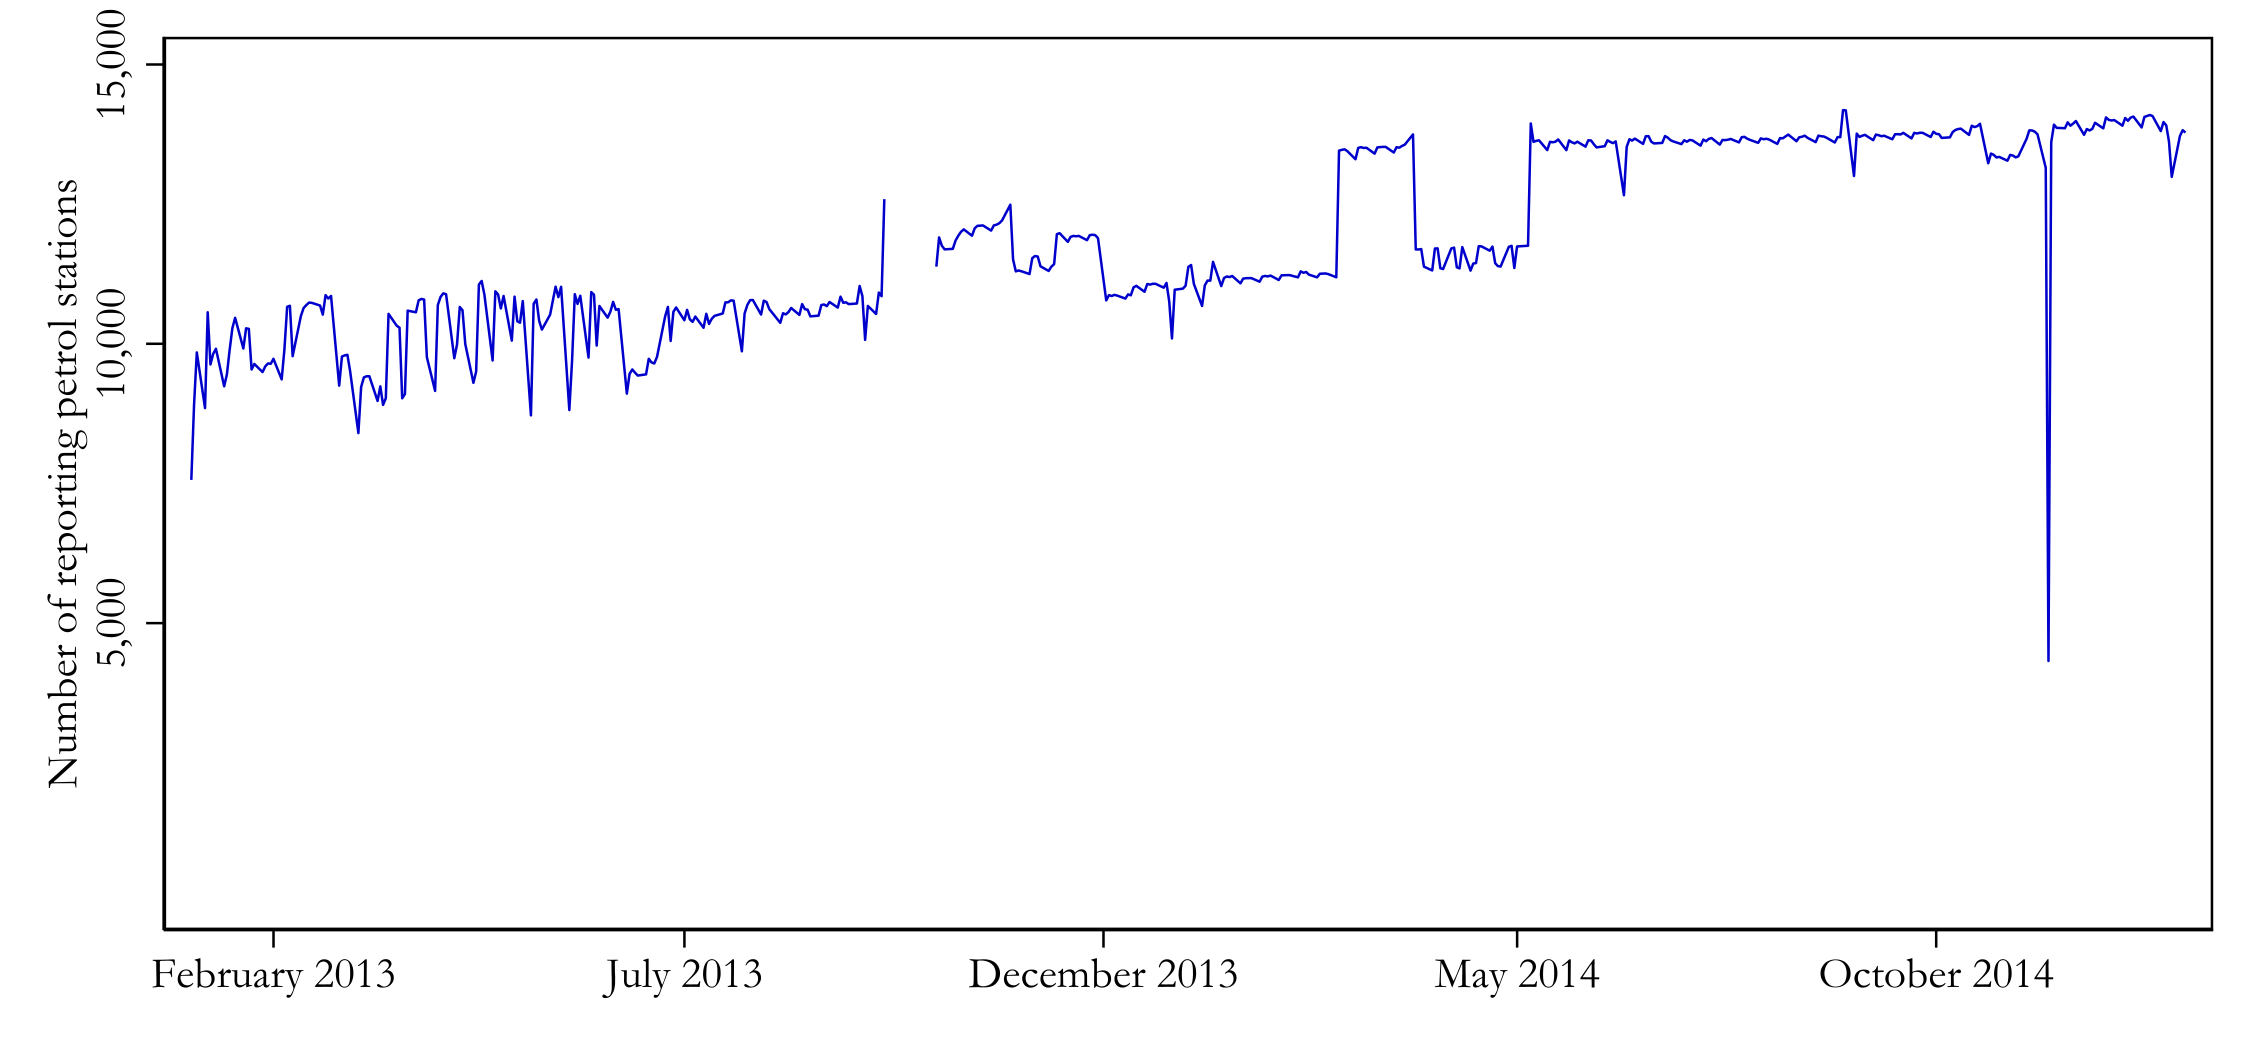
For most days in the pre-MPD period, we have prices for more than
\(80\%\) of fuel stations. To alleviate
the concern that reporting of prices might not be random, we use weekly
country-level average prices from the Weekly Oil Bulletin
before and after MPD and show that our results obtained with this
measure are very similar to the baseline. Another concern could be that
the composition of fuel stations changed before and after the
introduction of MPD. Table 1
presents summary statistics, which show that the composition of fuel
stations did not change significantly between the pre- and post-MPD
periods concerning the share of integrated stations, the share of
oligopoly stations or the number of competitors in local fuel
markets.Although
we observe an increase in the number of stations between the pre- and
post-MTU phases, this is attributable not to entry but to the change in
data source. The number of fuel stations remained stable over this time
period. A detailed split of fuel stations by brand before and
after the MPD introduction can be found in Table B1 of Appendix B.1 .
Overall, the composition of brands is very similar.
Table 1: Summary statistics
A. Station
characteristics
D pre-MPD
D post-MPD
F pre-MPD
F post-MPD
Number of stations
13,782
14,606
8,740
9,224
Share of integrated
stations
59%
57%
Share of oligopoly
stations
47%
46%
Median # comp. (5 km
catchment)
4
3
2
2
Share of local
monopolists
15%
15%
18%
19%
B. Prices and margins
D pre-MPD
D post-MPD
F pre-MPD
F post-MPD
at 5 pm
at 5 pm
at 5 pm
at 5 pm
Mean price, gasoline
1.60
1.50
1.58
1.52
Mean retail margin,
gasoline
0.08
0.05
0.11
0.10
Mean daily spread,
gasoline
0.09
0.07
0.13
0.15
Mean price, diesel
1.41
1.33
1.38
1.31
Mean retail margin,
diesel
0.11
0.09
0.11
0.10
Mean daily spread, diesel
0.09
0.08
0.13
0.13
Mean crude oil price,
Rotterdam
0.61
0.55
0.61
0.55
Notes: “D pre-MPD” and “D post-MPD” refer to fuel stations in Germany
before and after the introduction of MPD, respectively. “F pre-MPD” and
“F post-MPD” refer to fuel stations in France before and after the
introduction of MPD, respectively. The pre-MPD phase is from 1 January
2013 until 12 September 2013. The post-MPD phase is from 1 October 2013
until 31 December 2014. Prices are in euro per liter. The average daily
spread is measured as the average of the difference between the retail
margin at the \(95^{th}\) and \(5^{th}\) percentiles on each day.
The largest share of the retail price for fuel consists of taxes and
input costs. To analyze the share of the fuel price that can be
influenced by fuel stations, we further analyze the effect on retail
margins.
Since January 2007, all fuel stations in France selling more than 500
m\(^{3}\) of fuel per year have had to
report all price changes to a government agency similar to the MTU in
Germany. Regular checks are carried out and fines imposed on fuel
stations that do not comply with this rule. The French government makes
all price information since 2007 publicly available on a government
website.https://www.prix-carburants.gouv.fr/rubrique/opendata/,
last accessed March 2021. We thus observe the universe of price
changes of these fuel stations in France for our observation period. The
data are regarded as of very high quality and have previously been used
by Gautier and Saout
(2015).
The data set contains a list of notifications with the price, the
type of fuel, the address and geographic coordinates of the fuel
stations and the stations’ opening times. In contrast to the data from
the MTU in Germany, the French data do not contain any information on
the brand of the station or any other company-related information.
Local radio reports
With Germany’s introduction of mandatory price disclosure, some local
radio stations started broadcasting local fuel prices over the air.
Since some of the radio stations only started broadcasting prices after
the introduction of MPD, we exploit initial broadcasts of fuel price
information to study the effect of a follow-on information shock on
prices. To facilitate the data collection, we restrict this analysis to
the German state of Bavaria.
There are 381 radio stations in Germany broadcasting via short-wave,
out of which 83 are active in Bavaria. Among these, we identified and
contacted 60 radio stations that could potentially broadcast fuel
prices. In 2014, four local radio stations broadcast local fuel prices
(e.g., of the three lowest-price fuel stations in their reception area)
more than once a day at some point, and we know the dates between which
these broadcasts occur. We merge this information with data on the
geographic availability of radio stations which we received from
fmlist.org.
Search data, Google
trends, and app usage
We complement our data set with information that paints a fuller
picture of who is informed about prices, the salience of the
information, and its usage over time.
First, we use data on search queries in 2015 from a major smartphone
app displaying fuel prices to users in Germany. For each search query,
there is a unique device ID, a time stamp and the fuel type that was
searched for. We can therefore analyze how the extensive and intensive
margins of search differ between fuel types.
Second, we analyze information from Google Trends on keywords
surrounding the MTU. This tells us when public attention toward this
authority is particularly high and so when salience of fuel price
information is high.
Third, we have data on the monthly usage of three major price
comparison applications in Germany starting in May 2014.
Descriptive Evidence
Let us begin the empirical analysis by presenting descriptive
evidence on the price effect of mandatory price disclosure and its
interplay with the stylized model in Section 2.
Price information uptake
In Section 3, we show that, on average,
diesel car drivers drive twice as much as drivers of gasoline-powered
vehicles. If we believe that the overall cost of being informed about
prices (e.g., by using an app) does not differ across drivers, the
per-liter clearinghouse access cost for diesel drivers is lower. Thus,
in the context of the stylized model, we consider the clearinghouse
access cost curve pre- and post-MPD to be lower for diesel drivers, with
everything else held
constant.An
alternative that would lead to the same result would be to hold the
clearinghouse access costs fixed and assume that \(\upsilon\) is higher for diesel drivers
because they buy more fuel every month. The drawback of this approach is
that a unit would then become the monthly fuel consumption instead of a
single liter of fuel. Our approach more closely maps to the empirical
analysis we can perform. Prediction 1 states
that this leads to a higher equilibrium share of informed diesel drivers
pre- and post-MPD.
We can use data on price notifications by fuel type in the period
before MPD as a proxy for differences in the information levels between
fuel types. Intuitively, since fuel prices for price comparison apps
before MPD were user reported, drivers who report more prices are also
likely to use this price information more. To obtain a sense of the
relative share of informed diesel and gasoline drivers before MPD, we
adjust the daily number of diesel and gasoline price reports by the
respective number of vehicles in
circulation.From
the count of price notifications, we drop all instances when E5
gasoline, E10 gasoline and diesel prices are reported in the
same minute for the same station since these are likely prices
self-reported by stations, not reported by motorists. Sixteen percent of
all the price notifications are individual reports of either the
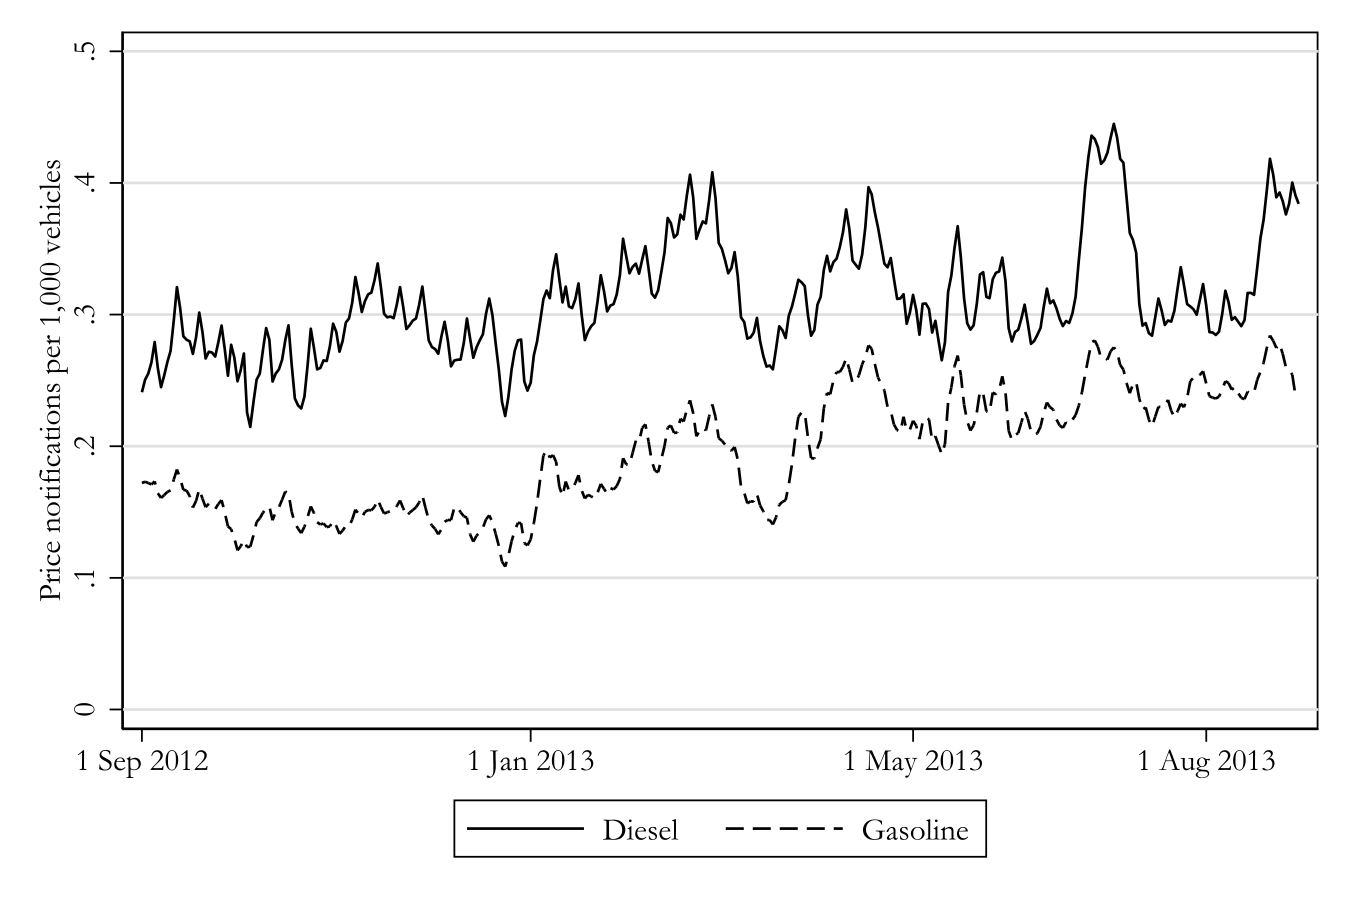
gasoline or the diesel price. Figure 3 shows the daily number of
price notifications per 1,000 vehicles in circulation for each day in
Germany between September 2012 and August 2013. The number of diesel
price notifications per diesel car in circulation is approximately \(64\)% higher than that of gasoline
notifications. Consistent with Prediction 1, this
suggests that diesel drivers were, on average, more informed about
prices than gasoline drivers prior to MPD.
Notes: The figure shows the daily number of price notifications by
fuel type reported by individual users to a major German smartphone app
per 1,000 diesel or gasoline vehicles in circulation. The data are from
September 2012 to August 2013. The solid line corresponds to the
notification intensity for diesel. The dashed line corresponds to the
notification intensity for gasoline.
After the introduction of MPD, user reporting of prices became
obsolete. Information on differences in app usage between drivers of
vehicles of each fuel type can nevertheless provide evidence on their
relative differences in information levels. To this end, we use data on
search queries from a major app providing fuel prices in Germany in
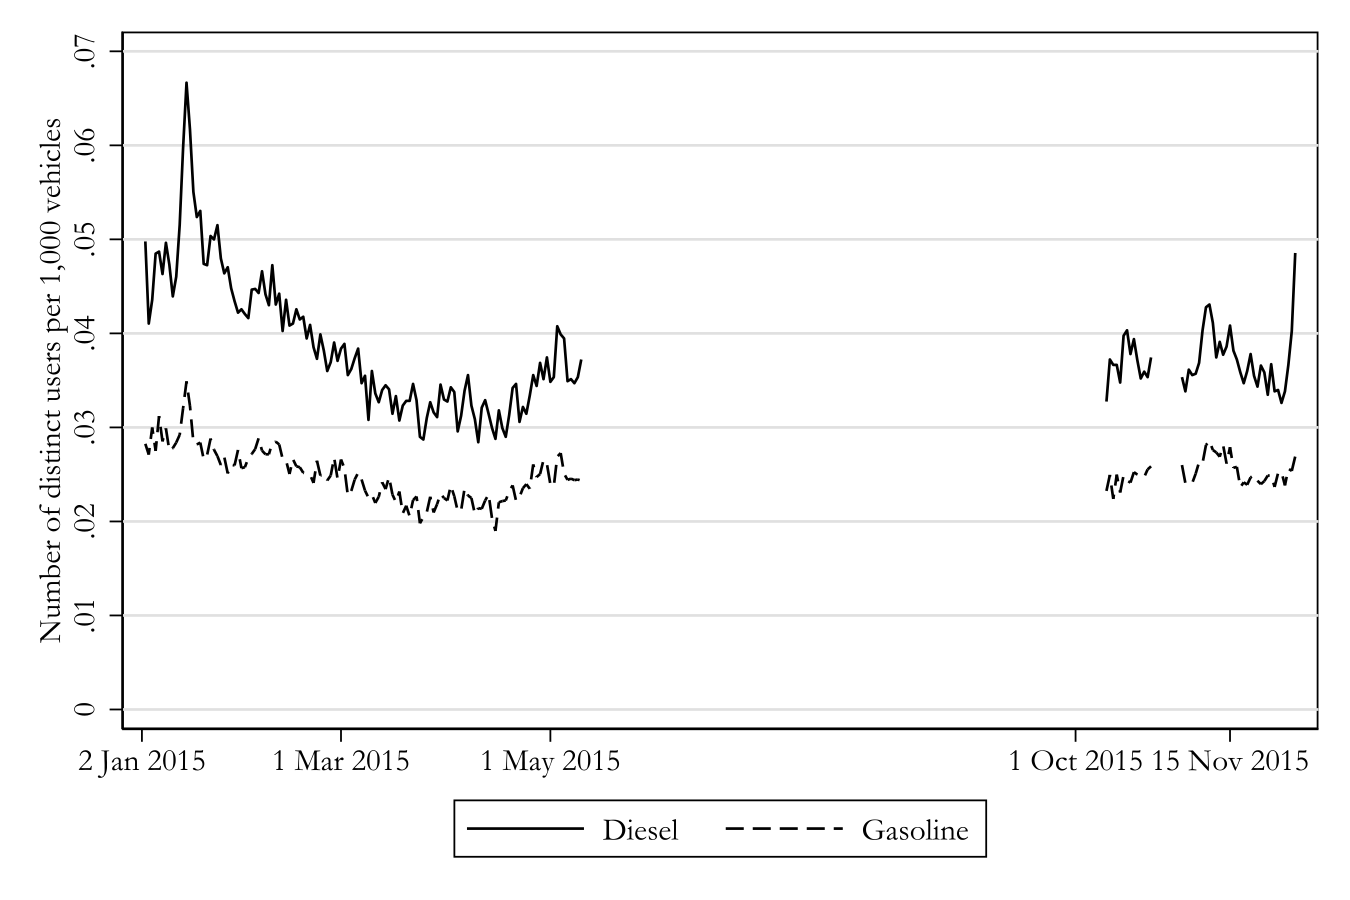
2015. Figure 4 shows the number of daily
unique users searching for gasoline and diesel prices per 1,000 vehicles
of the particular fuel type in circulation. These data are available for
January to May 2015 and October to December 2015. The number of unique
searchers (as opposed to the number of searches) captures the extensive
margin of information usage and is thus similar to capturing differences
in information through the share of shoppers in the theoretical
model.Appendix
Figure C1 shows that there are no intensive margin search differences
between fuel types. Similarly to the pre-MPD pattern and
consistent with Prediction 1, the
share of searchers is higher among diesel than among gasoline
drivers.
Notes: The figure shows the daily number of distinct users who
searched for the diesel or gasoline price in Germany in 2015 per 1,000
diesel or gasoline vehicles in circulation.
Mandatory
price disclosure and the value of information
To analyze the effect of MPD on price dispersion, we construct
overlapping markets of 5 km driving distance using the road network
around a focal fuel station. For every market, we calculate the VOI as
the difference between the average price and the minimum price at 5 pm
on a particular day. This is the expected per-liter savings of a
motorist who buys at the lowest price in the local market instead of at
a randomly drawn price.
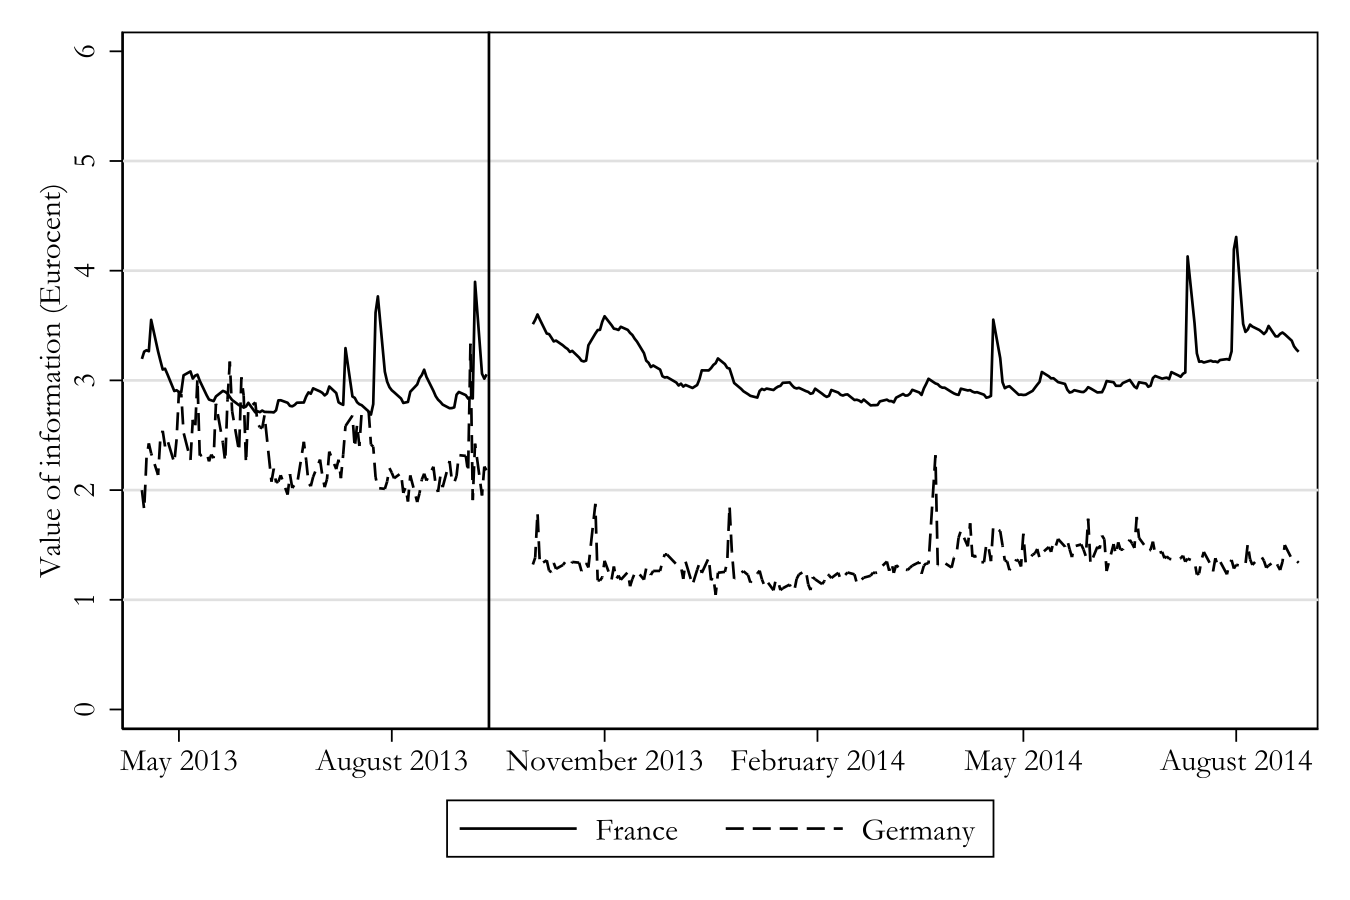
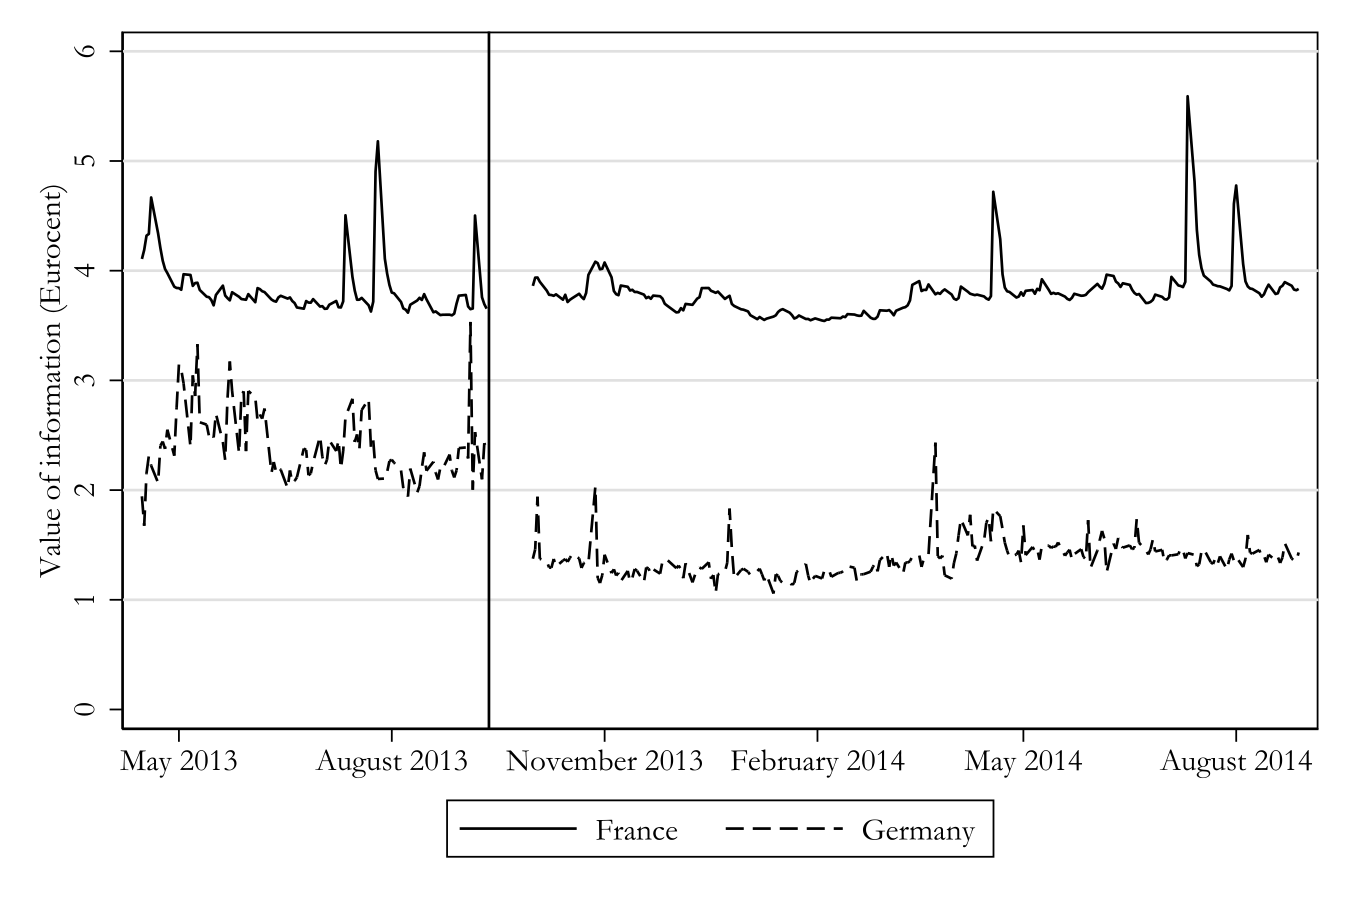
Figure 5 plots the average
VOI in Germany and France before and after the introduction of MPD for
gasoline and diesel. For both fuel types, MPD led to a decrease in the
VOI, which, according to Prediction 2, suggests that the
share of ex ante informed consumers is greater than \(\hat{\mu}\). Furthermore, the decrease in
the VOI is larger for gasoline (with a lower \(\mu_0\)) than diesel (with a higher \(\mu_0\)).
GasolineDiesel
Notes: Panel (a) shows the value of information, defined as the
difference between the within-market average and minimum price, for
gasoline in Germany and France. Panel (b) shows the VOI for diesel in
Germany and France. The vertical line represents the introduction of MPD
in Germany.
Figure 5: Effect of mandatory price disclosure on the value of information
Treatment intensity over
time
Next, we analyze the treatment intensity and usage of price
information over time. Figure 6
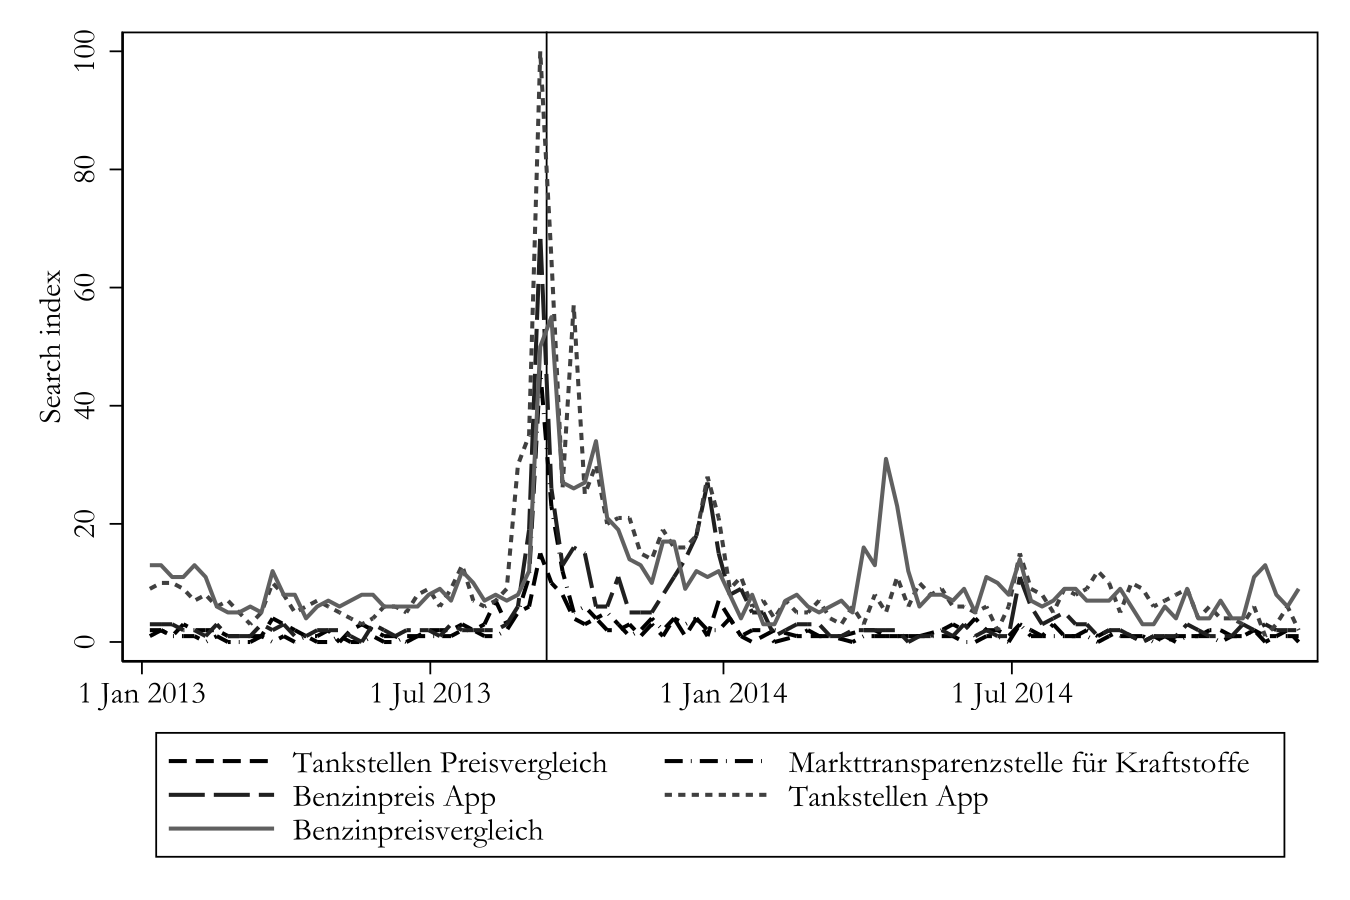
plots the search index for different keywords surrounding MPD, fuel
prices and price comparison apps on Google in Germany between January
2013 and December 2014. These are indexed such that 100 corresponds to
the week–keyword combination with the most search queries. Searches for
all keywords peaked in mid-September, when MPD began. Whereas searches
for the market transparency unit itself declined again quickly, searches
for “Tankstellen App” (fuel station app), “Benzinpreis
App” (fuel price app), or “Benzinpreisvergleich” (fuel
price comparison) remained high until mid-January 2014.
Notes: The figure shows the evolution of Google searches in Germany
between 1 January 2013 and 31 December 2014 for MPD-related keywords.
Searches are indexed such that 100 corresponds to the moment in time and
keyword with the highest number of searches during the observation
period. The search terms are “Tankstellen Preisvergleich” (fuel
station price comparison), “Marttransparenzstelle für
Kraftstoff” (market transparency unit for fuel), “Benzinpreis
App” (fuel price app), “Tankstellen App” (fuel station
app), and “Benzinpreisvergleich” (fuel price comparison). The
vertical solid line marks the launch of the MTU.
Figure 6: Evolution of Google searches for
MPD-related search terms in Germany
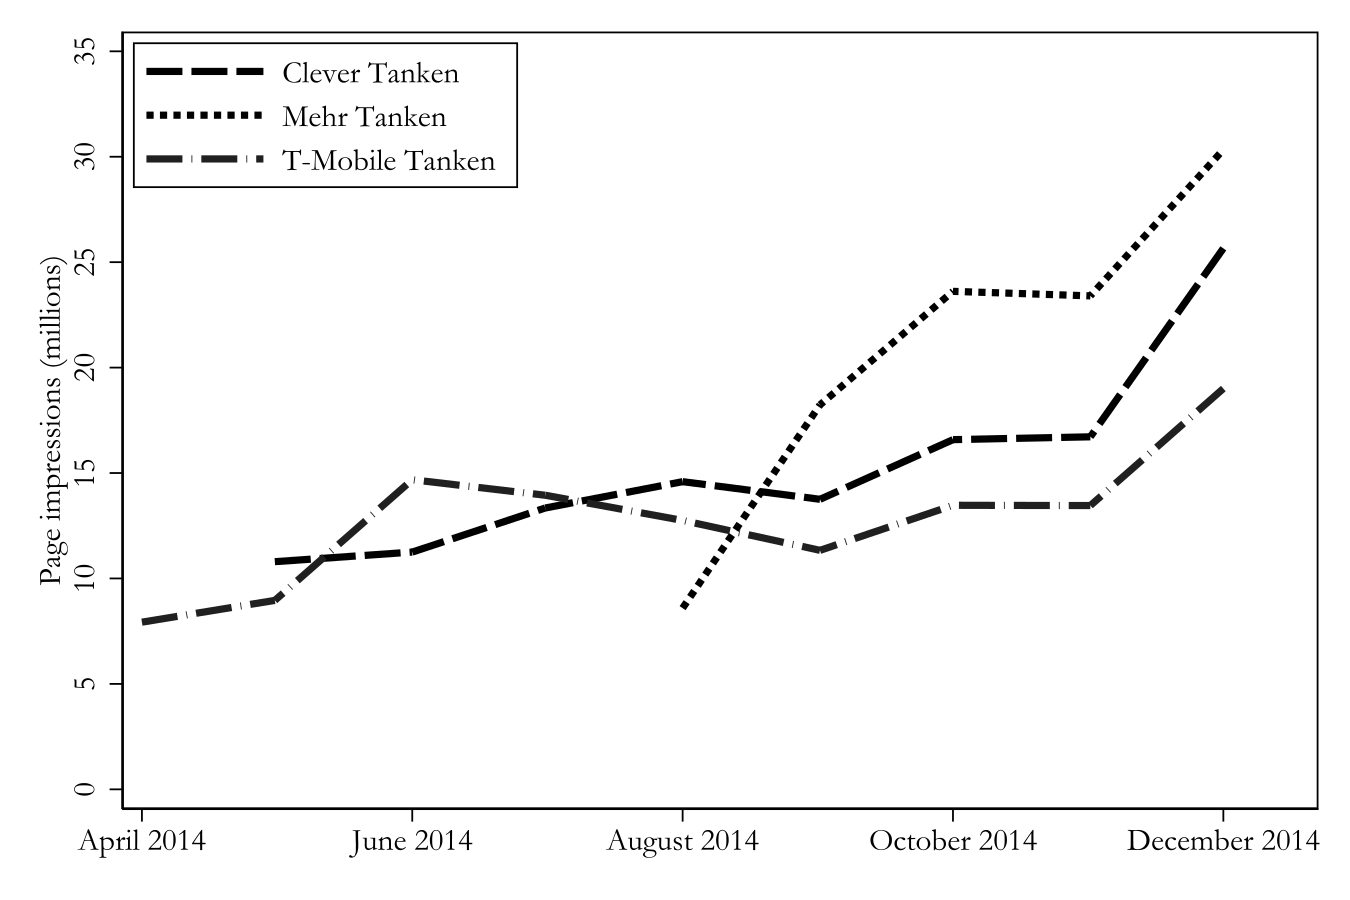
Figure A.1 shows the evolution of
monthly page impressions for three price comparison apps for which data
are available starting from April 2014, which was after the period of
high interest between September 2013 and January 2014 according to the
Google search data. Using these trends to interpret the usage level of
smartphone apps is difficult both because it is unclear how page
impressions relate to the number of unique users and because these are
just three out of 44 fuel price comparison apps registered in 2014.
However, their continued usage between April and December 2014 does show
that app usage did not stop shortly after the introduction of MPD.
Notes: The figure shows the evolution of monthly page impressions for
three popular mobile price comparison applications. Each line begins at
the month when our data coverage for the particular app starts and ends
at the end of our sample period, in December 2014.
Figure A.1: Monthly page
impressions
Price effect of
mandatory price disclosure
Finally, we turn to how mandatory price disclosure affects average
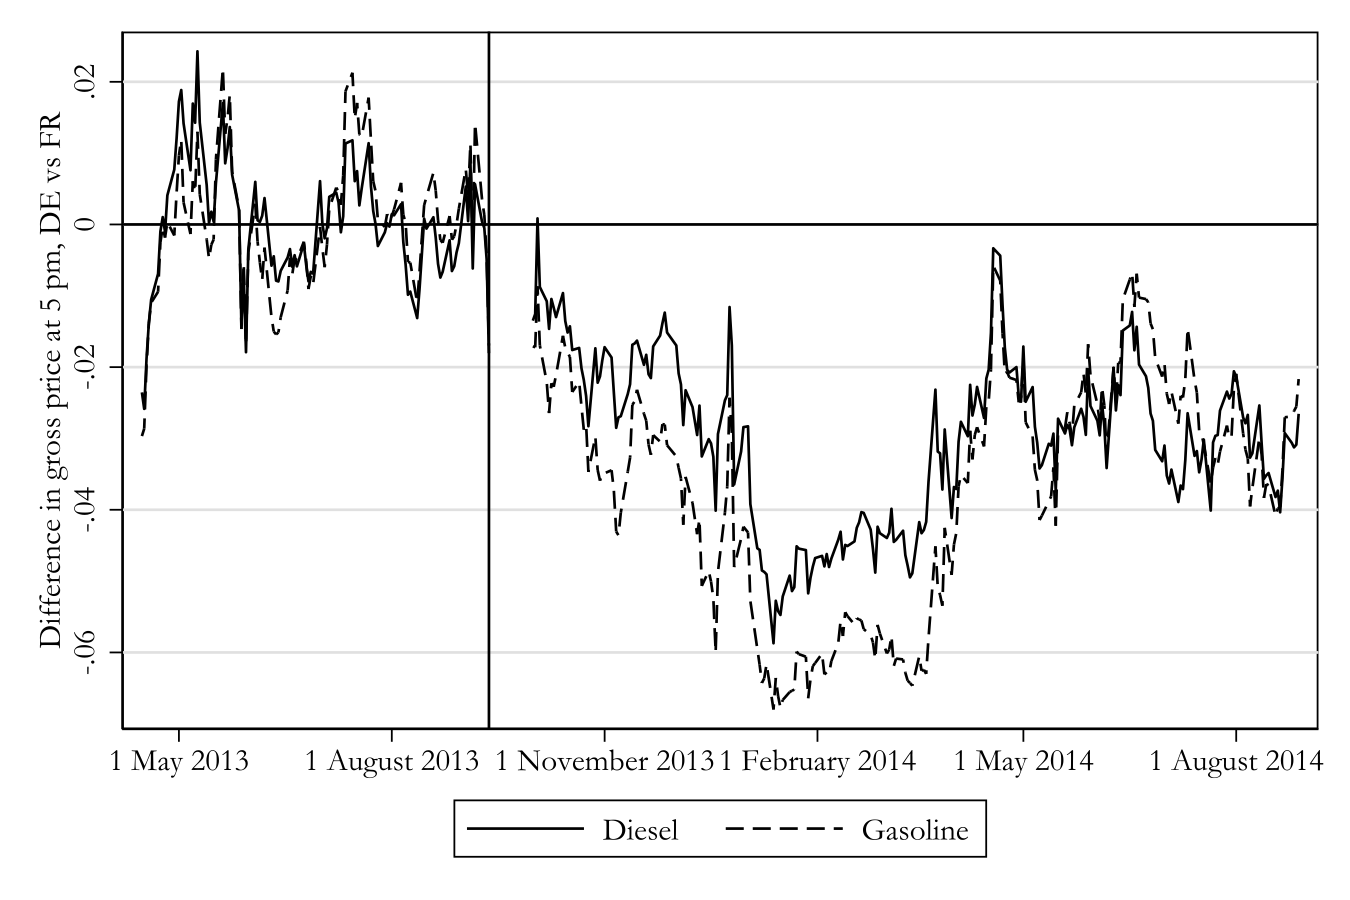
diesel and gasoline prices over time. Figure 7 shows the evolution of
gross prices in Germany relative to that of prices in France between
April 2013 and September 2014 for diesel and gasoline. The solid line
plots the difference in daily diesel prices between Germany and France,
de-meaned by the average difference prior to MPD. The dashed line plots
the same for gasoline.
Notes: The solid line shows the evolution of the difference in daily
diesel prices between Germany and France, de-meaned by the corresponding
average difference prior to MPD. The dashed line shows the evolution of
the analogous difference for gasoline. The vertical solid line marks the
beginning of MPD.
Figure 7: De-meaned difference in gross
prices between Germany and France
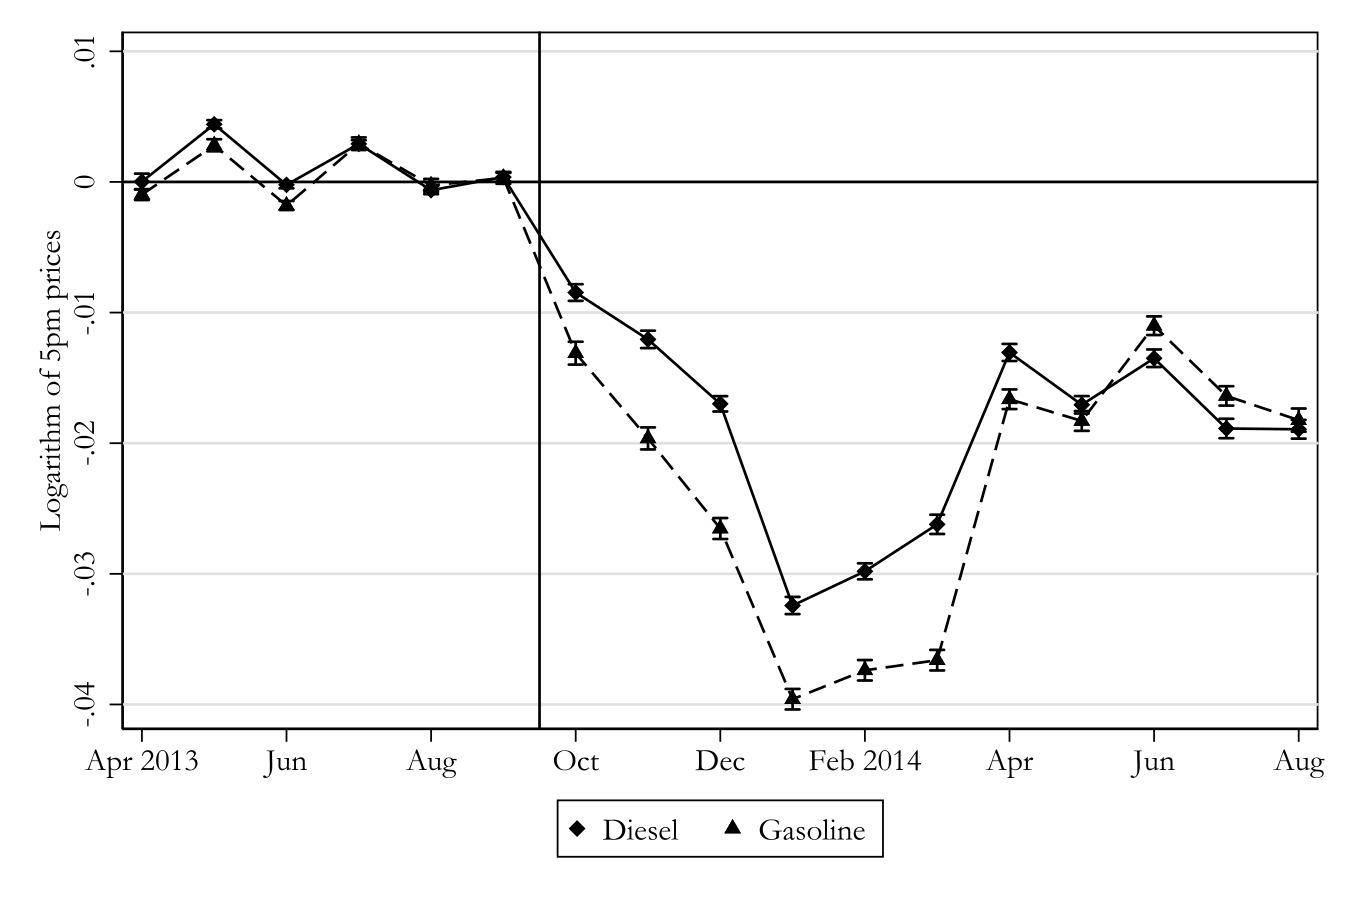
Before MPD, the de-meaned price difference oscillated around zero for
both fuel types. After MPD, prices fell more strongly for gasoline than
for diesel. Given that the VOI fell more for gasoline, this is
consistent with the stylized model.
The effect of MPD was strongest from January 2014 and weakened after
May 2014. Thereafter, it stabilized at an economically significant
level. This coincides with the public attention devoted to fuel price
comparison apps. It suggests that public attention to the price
information is key to exploiting the full potential of MPD.
Empirical Strategy
To unpack the mechanisms driving the price effect of MPD, we explore
how it varies under different circumstances, such as between fuel types,
with the number of competitors or when accompanied by a follow-on
information campaign.
Identification strategy
Our main identification strategy relies on a synthetic
difference-in-differences design in which we compare fuel prices at
stations in Germany to those in France before and after MPD. Whenever
this is infeasible, we use a traditional difference-in-differences
approach.
SDID combines the advantages of difference-in-differences with those
of synthetic control methods (see (Arkhangelsky et al. 2021)).
Similarly to difference-in-differences, SDID estimates the treatment
effect by comparing the difference in outcomes of a treatment and a
control group before and after the treatment and relies on the parallel
trends assumption. Similarly to the synthetic control method, SDID
reweights units in the control group to make the pretrends in outcomes
as similar as possible to those of the treatment group. Arkhangelsky et al.
(2021) report that SDID performs weakly better than synthetic
control and difference-in-differences methods.
The estimation proceeds in two steps. In the first step, we compute
weights for the control units and the pretreatment time periods. The
SDID unit weights are designed to minimize the difference in pretrends
of outcomes between the exposed and unexposed units. The SDID time
weights are set to balance the time periods before and after the
treatment for the control units and emphasize the pretreatment time
periods most predictive of the post-treatment periods. In the second
step, we estimate the treatment effect using the unit and time weights
from the first
step.In
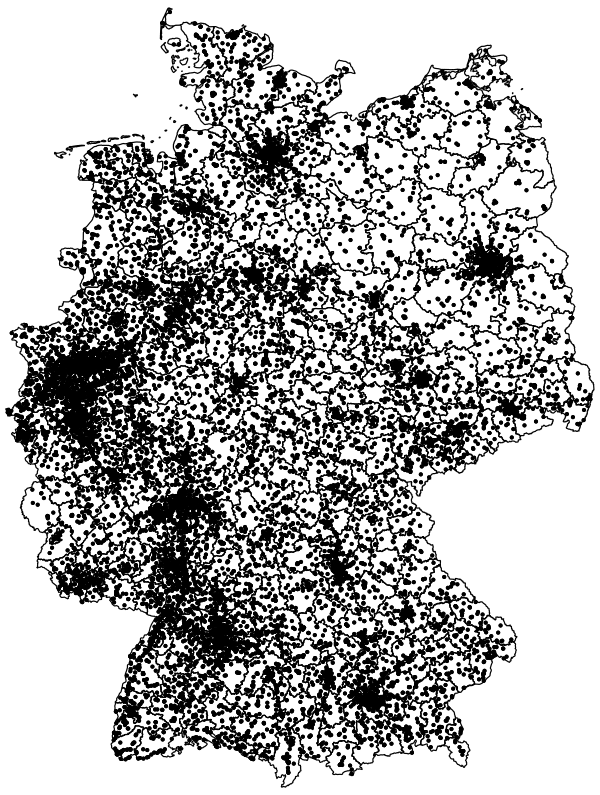
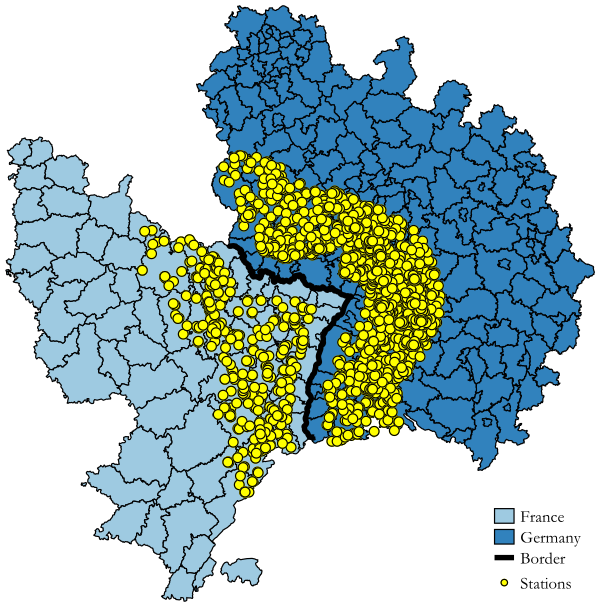
Appendix B , we show the geographic distribution of control stations
that receive a disproportionately higher unit weight in the estimation
via SDID. These stations are scattered throughout France and do not
appear to cluster in a particular region. Therefore, potential
clustering of control stations due to the reweighting in SDID does not
affect our results. Standard errors are computed from 200
bootstrap draws.
Specifically, we solve the following minimization problem:
\[\begin{equation}
\tag{1}
\label{eq_tr: sdid}
\displaystyle (\hat{\beta}^{sdid}, \hat{\mu}, \hat{\alpha},
\hat{\gamma}) = \operatorname*{arg\,min}_{\beta, \mu, \alpha, \gamma}
\left\{{\sum_{i=1}^{N} \sum_{t=1}^{T} \left(Y_{it} - \mu - \alpha_{i} -
\gamma_{t} - MPD_{it} \beta\right)^{2} \hat{w}_{i}^{sdid}
\hat{\tau}_{t}^{sdid}}\right\},
\end{equation}\] where \(\hat\beta\) corresponds to the estimated
effect of MPD and \(\hat{w}_{i}\) and
\(\hat{\tau}_{t}\) are the SDID unit
and time weights. \(Y_{it}\) is the
logarithm of the fuel price at station \(i\) and week \(t\). \(\alpha_{i}\) and \(\gamma_{t}\) are fuel station and week
fixed effects. The variable \(MPD_{it}\) is a dummy that equals one for
treated units after the treatment. These are fuel stations in Germany
after the introduction of MPD.
Estimation of the treatment effect with SDID requires a balanced
panel. We compute weekly average fuel prices and restrict our sample to
fuel stations in Germany and France with no missing weekly price
observations.We
use weekly average fuel prices since a high share of stations in Germany
have at least one day without a reported fuel price during the time
period used in the estimation of the treatment effect. These
correspond to 47% of the stations in Germany and 94% of the stations in
France.
This restriction raises two potential concerns: First, dropping 53%
of the German stations in our data may lead to selection bias. Second,
that we are missing at least one week of price data for 53% of the
German stations is a reminder that the data for the pre-MPD period in
Germany are a user-reported subsample of prices that could also suffer
from selection bias. To address the first concern, we estimate the
effect of MPD using regular difference-in-differences and the full,
unbalanced panel with daily price observations. To deal with the second
concern, we use the country-level weekly fuel prices for all countries
in the European Union published by the European Commission in its
Weekly Oil Bulletin. We use this alternative aggregate
administrative data source that does not change around the time of MPD
to estimate a difference-in-differences model where we treat Germany as
the treatment group and all other countries in the European Union as the
control group. Our results under both of these alternative strategies
are robust and are reported in Appendix D .
France as control group
We identify the effect of MPD using the evolution of fuel prices at
fuel stations in France for comparison. Two assumptions must be met to
identify the effect of MPD in our framework: The first is that no
transitory shocks other than MPD itself affected fuel stations in France
and Germany differently before and after the introduction of MPD. The
second is that there were no spillovers from the treatment to the
control group.
Our station fixed effects capture time-invariant differences between
fuel stations in France and Germany. Our week fixed effects capture
transitory shocks that affected French and German fuel stations equally.
Given the two countries’ similarity in size, wealth and geographic
location and our narrow observation period, there should not have been
any additional transitory demand and supply shocks that affected France
and Germany differently. We nevertheless discuss the most obvious
candidates.
Important transitory demand shocks in the retail fuel market are
school and public holidays as well as local economic shocks. School and
public holidays in France and Germany are highly correlated. In
addition, since holidaymakers in Europe often cross several countries on
the way to their holiday destination and France and Germany are popular
holiday destinations and important transit countries, they are usually
hit similarly and at the same time by these demand shocks.
Transitory supply shocks affect fuel stations in much the same way.
Given the countries’ geographic proximity, fuel stations in France and
Germany procure most of their fuel from similar sources. Furthermore,
the European Single Market and the Schengen Agreement mean that customs,
border controls and other regulatory hurdles do not restrict arbitrage
possibilities between the two countries. To nevertheless ensure we
eliminate any transitory shocks to input prices and restrict our
analysis to the share of the fuel price that can be affected by fuel
stations, we additionally use retail margins as outcome variables. These
retail margins are net of taxes, levies and the wholesale price of Brent
oil in Rotterdam on a given day.
A further benefit of our using fuel stations in France as a control
group is that there were no important regulatory changes in the French
fuel market over our observation period. The impact of the introduction
of mandatory price disclosure in 2007 should have stabilized by 2013 and
should thus not have affected different French fuel stations differently
over our observation period. In contrast to other countries, France,
similarly to Germany, did not restrict its fuel stations in their
price-setting behavior other than by imposing mandatory price
disclosure.In
2011, Austria, for example, introduced a rule banning fuel stations from
raising prices more than once a day.
To test the robustness of the analysis to a more conservative
interpretation of our identifying assumptions, we rerun our analysis for
a subsample of the data around the France–Germany border, where economic
conditions should be even more similar because of geographic proximity.
First, we restrict our analysis to fuel stations that are 100 km to the
left and right to the border. The fuel stations in the treatment and
control groups are thus in the same economic area and exposed only to
common transitory shocks. Second, to eliminate any potential spillover
effects, we drop all fuel stations less than 20 km to the left and right
of the border. We are left with a donut SDID comparing stations on both
sides of the border that are geographically close but dropping stations
that are potentially subject to spillover effects.
Role of prior information
To test the role of prior information, we estimate the effect of MPD
separately for diesel and gasoline. A key advantage of this analysis is
that the same stations sell the different fuel types. They therefore
face the same number of local competitors and, more generally, the same
supply-side conditions. To the extent that the differential reaction of
consumers to MPD is not attributable to something other than ex ante
information, we can learn how ex ante information impacts the effect of
MPD through this comparison. Based on the stylized model and the
descriptive evidence, we should expect a larger price effect of MPD in
the gasoline market, where there are fewer ex ante informed
consumers.
Treatment effect over time
Next, we set out to study the effect of MPD over time. We estimate
the parameters of the following regression model:
\[\begin{equation}
\tag{2}
\label{eq_tr: timevar}
ln(p_{it}) = \sum_{j=-5}^{11}\beta_{j} MPD_{it} + \alpha_{i} +
\gamma_{t} + \epsilon_{it},
\end{equation}\] where \(ln(p_{it})\) is the logarithm of the
monthly average fuel price at station \(i\). \(\beta\) captures the effect of mandatory
price disclosure starting five months before its introduction and up to
eleven months after. The regression is weighted by the SDID unit and
time weights, and we include fuel station and month fixed effects.
This analysis allows us to understand whether the effect of MPD was
short-lived around the time that it received public attention or rather
was more persistent.
Market-level analysis
Prediction 3 indicates that MPD
should have decreased the average price in a local market more than the
minimum price. To test this prediction, we use the same overlapping 5 km
driving-distance markets that we used to compute the VOI in Section 4.
We estimate the price effect of MPD on the average price and the
minimum price using a difference-in-differences design that compares
market-level prices in Germany and France. Each observation is the daily
average price (minimum price) at 5 pm of a particular fuel type in a
local market.
Supply-side factors
Although the stylized model makes no predictions on the role of
supply-side factors that are empirically falsifiable with our data, it
does highlight that supply-side factors play an important role in
mediating the effect of MPD.
A local monopolist does not face any competition from other stations,
and so mandating price disclosure should not have an effect in such
markets. In practice, we define a local monopolist as a station without
a rival at a driving distance of up to 5
km.The
empirical literature analyzing price dispersion in retail fuel markets
defines geographic markets in different ways. For example, Chandra and Tappata
(2011) consider 1 mile and 2 mile radiuses, while Barron et al. (2004),
Hosken et al.
(2008) and Lewis
(2008) consider a radius of 1.5 miles. Carranza et al. (2015) employ a
clustering algorithm to create nonoverlapping markets. Although
it is reasonable to assume that a motorist who arrives at the station
and whose only purpose is to buy fuel is not going to drive more than 5
km to the next station, this “local monopolist” may still very well face
competition from other stations. For example, commuters who drive past
this station and another station outside this radius on their daily
route to work will consider both stations. Thus, we do not expect a null
effect of MPD on stations without competitors within a 5 km driving
distance.
To test the effect of MPD on local monopolists and the role of the
number of sellers in mediating the price effects of MPD, we estimate how
the effect of MPD varies with the number of local competitors.
Two further dimensions were key in the market investigation by the
German Federal Cartel
Office (2011) that preceded the introduction of MPD. First, there
was the question of whether integrated competitors (i.e., firms that act
as upstream suppliers of fuel and also operate refineries and downstream
stations) harmed competition. Second, a subset of these vertically
integrated competitors were identified as oligopolists wielding market
power.These
are BP, ConocoPhillips, ExxonMobil, Shell and Total. We therefore
estimate whether the treatment effect varies if a station belongs to an
integrated competitor or to an oligopolist.
Follow-on information
campaigns
The descriptive evidence in Figure 7
suggests that the effect of MPD decreased over time. This decrease
coincided with a decline in Google searches for MPD-related terms and
presumably of public attention to the policy. Prediction 4 suggests that higher
treatment intensity leads to larger MPD-induced price decreases. To test
whether follow-on information campaigns can strengthen the treatment
effect, we exploit the fact that some local radio stations started
broadcasting local fuel prices over the air after the introduction of
MPD.
We limit the burden on data collection by restricting our analysis of
radio reports to those aired by stations in the state of
Bavaria.The
fuel stations in the treatment and control groups for this exercise are
therefore also all in Bavaria. We identify four radio stations
with segments recurring at least daily in which they broadcast the
prices at the cheapest fuel stations in the reception area. Two of these
radio stations were already broadcasting the lowest fuel prices among
those called in by their listeners before MPD started. We exclude all
fuel stations in these stations’ reception areas from the analysis, as
they were treated throughout the observation period. The two remaining
radio stations are Radio Arabella, which started broadcasting fuel price
segments on 25 April 2014, and Extra-Radio, which started its
corresponding broadcasts on 2 February 2014.
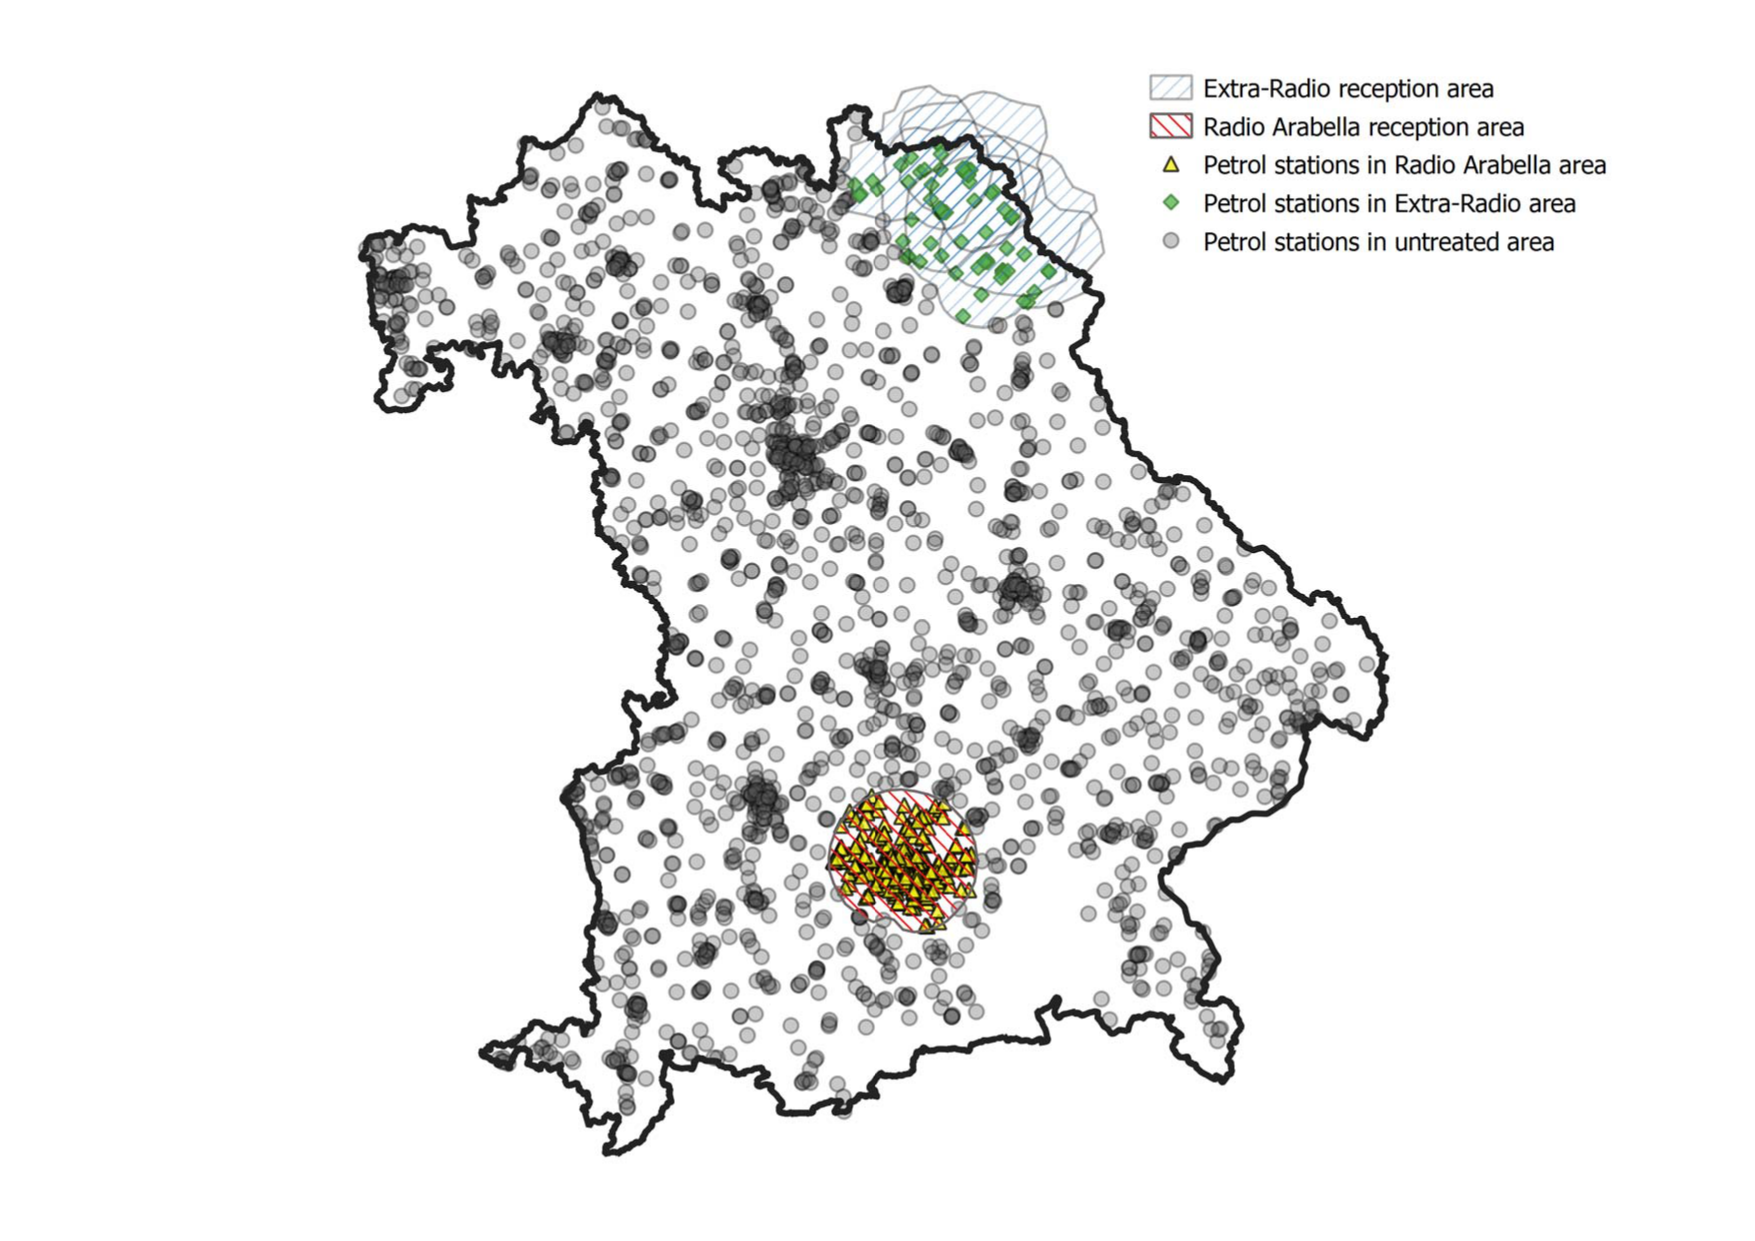
Figure A.2 shows the reception
areas of Radio Arabella and Extra-Radio. For each fuel station, we know
whether, on a particular day, it was within the reception area of a
radio station broadcasting prices.
Figure A.2: Radio reception areas and fuel
stations in Bavaria
We estimate the parameters of the following regression model: \[\begin{equation}
\tag{3}
\label{eq_tr: radio}
ln(p_{it}) = \beta_0 + \beta_1 Radio_{it} + \alpha_{i} + \gamma_{t} +
\epsilon_{it} \,,
\end{equation}\] where \(ln(p_{it})\) corresponds to the logarithm
of the gross price for diesel or gasoline at station \(i\) at time \(t\) and \(Radio_{it}\) is a dummy equal to one if
fuel station \(i\) lies in the
reception area of a radio station broadcasting local fuel prices at date
\(t\). \(\alpha_{i}\) is fuel station fixed effects,
and \(\gamma_t\) is date fixed
effects.
Since our analysis is restricted to Bavaria, we can rule out that
fuel stations in the control group were affected by reports by radio
stations we did not survey. We restrict our analysis to the period
October 2013 until September 2014, the twelve months after the beginning
of MPD.
A potential threat to identification could be that radio stations
anticipated a trend that would create local demand for reports about
fuel prices and also affected fuel prices. This seems unlikely. After
multiple interviews with program directors, we learned that the decision
to broadcast fuel prices was based not on a market analysis but on the
fit of such a segment within the station’s existing programming.
In our treatment group, we consider radio reports about fuel prices
from Extra-Radio, which broadcasts in and around Hof, a city in
northeastern Bavaria close to the Czech border, and Radio Arabella, a
radio station broadcasting in and around Munich. Whereas Extra-Radio
broadcast the lowest fuel prices in its reception area daily between 2
February 2014 and 5 March 2017, Radio Arabella started reporting the
lowest prices several times a day on 25 April 2014, and its reports went
on until at least 2019.
To account for treatment effect heterogeneity, we estimate the
regression model for both radio stations separately. In each regression,
we exclude fuel stations within the reception area of the other radio
station from the control group.
Results
This section presents the results of our empirical analysis. Our aim
is to shed light on the mechanisms by which mandatory price disclosure
affects prices.
MPD effect by fuel type
Table 2 shows the average effect of mandatory
price disclosure by fuel type. Columns (1) and (2) present the effect of
MPD on the logarithm of fuel prices for gasoline and diesel,
respectively, using the full sample of French and German fuel stations.
Columns (3) and (4) present results where the sample is restricted to
fuel stations 20 to 100 km from the France–Germany
border.The
results are robust to changes to the distance thresholds. We provide
estimates from exercises with alternative thresholds in Appendix D.3
.
Consistent with the descriptive results in Section 4, the main takeaway is that
MPD is successful at decreasing prices and that its effectiveness is
higher for gasoline than for diesel. Since we observe a larger decrease
in the VOI for gasoline and a larger price effect of MPD for gasoline,
the model suggests that this is because with a lower share of ex ante
informed consumers, MPD increases the share of informed consumers by
more than for diesel. Since the same fuel stations offer both diesel and
gasoline, supply-side characteristics cannot explain these
differences.
Table 2: Effect of MPD on log gross prices
Gasoline
Diesel
Gasoline
Diesel
(1)
(2)
(3)
(4)
MPD
-0.027\(^{***}\)
-0.018\(^{***}\)
-0.030\(^{***}\)
-0.019\(^{***}\)
(0.0004)
(0.0004)
(0.0011)
(0.0014)
95% confidence interval
[-0.028, -0.027]
[-0.018, -0.017]
[-0.032, -0.027]
[-0.022, -0.016]
Week FE
Yes
Yes
Yes
Yes
Station FE
Yes
Yes
Yes
Yes
Observations
647,500
768,550
50,400
56,500
Notes: Columns (1) and (2) present estimates of the effect of MPD on
log weekly prices for gasoline and diesel, respectively, using all fuel
stations in Germany and France. Columns (3) to (4) include the same
estimates for a restricted sample of fuel stations 20 to 100 km from the
France–Germany border. The observation period is from 15 April 2013 to
31 March 2014. Standard errors are computed from 200 bootstrap draws and
are reported in parentheses. \(^{*}\)\(p<0.10\), \(^{**}\)\(p<0.05\), \(^{***}\)\(p<0.01\)
An unobservable dimension along which the gasoline and diesel markets
differ could be the usefulness of the information provided by MPD. It
seems plausible that, since diesel drivers drive more, MPD is more
useful to them and therefore reduces their clearinghouse access costs
more. However, if this were the case, we should see a larger price
effect of MPD for diesel than for gasoline. If anything, we are
therefore underestimating the role that the ex ante share of informed
consumers plays.
We report the effect of MPD on retail margins in Table C5 of Appendix
D.5 . We find that MPD decreases gasoline margins by approximately 3
eurocents and diesel margins by approximately 2 eurocents. For
reference, according to the industry data provider Energie
Informationsdienst (EID), gross margins were on average 10.7 eurocents
for gasoline and 11.0 eurocents for diesel in the twelve-month period
ending in August 2013.
To test the robustness of our results, we run additional checks whose
results we summarize in Appendix D . Our results hold across all
alternative specifications.
MPD effect over time
Figure 8 shows how the effect of mandatory
price disclosure evolved over time. Fuel prices started dropping in the
first month after the introduction of MPD. This coincides with the
strong public interest in this policy exemplified in Figure 6. The effect intensified
over time and was stronger for gasoline than for diesel.
The largest effect of MPD can be observed in January 2014, after
which it dropped by approximately half. The decrease in the treatment
effect was more pronounced for gasoline than for diesel. This coincides
with the sharp drop in public attention to mandatory price disclosure
shown by the evolution of Google queries in Figure 6. Thereafter, the effect of
MPD stayed at a smaller but stable level. This is in line with evidence
of stable and continuous use of price comparison apps after April 2014.
The MPD-induced price effect stabilized at approximately the same
percentage-point value for diesel and gasoline. As the price level of
gasoline is higher than that of diesel, the long-term price effect in
eurocents is stronger for gasoline than for diesel.
Notes: The figure shows the time-varying monthly treatment effects of
MPD on log weekly prices for gasoline and diesel between April 2013 and
August 2014 and includes 95% confidence intervals based on standard
errors computed from 200 bootstrap draws. The vertical solid line marks
the beginning of MPD.
Figure 8: Time-varying effect of MPD on log
gross prices
MPD effect at the market
level
Table 3 shows the results from the
market-level analysis using overlapping 5 km driving-distance markets.
Each observation is the market-level average or minimum price in Germany
or France on a particular day.
Table 3: Effect of MPD on log market-level
prices
Gasoline
Diesel
(1)
(2)
(3)
(4)
Outcome variable:
Average
Minimum
Average
Minimum
MPD
-0.030\(^{***}\)
-0.024\(^{***}\)
-0.024\(^{***}\)
-0.018\(^{***}\)
(0.0001)
(0.0001)
(0.0001)
(0.0001)
Date FE
Yes
Yes
Yes
Yes
Station FE
Yes
Yes
Yes
Yes
Observations
5,281,266
5,281,266
5,369,616
5,369,616
Adjusted \(R^{2}\)
0.855
0.810
0.805
0.784
Notes: Columns (1) and (3) present estimates of the effect of MPD on
log daily average prices for gasoline and diesel, respectively, at the
market level in Germany and France. Columns (2) and (4) present
estimates of the effect of MPD on log daily market-level minimum prices.
Standard errors clustered at the market level are in parentheses. \(^{*}\)\(p<0.10\), \(^{**}\)\(p<0.05\), \(^{***}\)\(p<0.01\)
The outcome variable in Columns (1) and (3) is the average price for
gasoline and diesel, respectively. The outcome variable in Columns (2)
and (4) is the respective minimum prices. Consistent with Prediction 3, MPD decreases the
average price in a local market more than the minimum price.
Beyond lending support to the model, this finding also has
distributional consequences. It means that MPD benefits previously
uninformed consumers more than previously informed consumers through two
channels: First, it turns uninformed consumers into informed consumers,
who purchase at the minimum rather than the average posted price
post-MPD. Second, it reduces the price paid by consumers who remain
uninformed more than that paid by those who are always informed.
MPD effect
under different supply-side conditions
Table 4 shows how the effect of MPD
varies for gasoline and diesel between fuel stations that differ along
supply-side conditions. Columns (1) and (4) show how the effect of MPD
varies between stations with a different number of competitors within a
5 km radius. Whereas stations that do not have a competitor within a 5
km radius still lower their price in response to MPD, this effect
intensifies the more local competitors there are. Although it may at
first seem surprising that stations without a nearby competitor are
affected by MPD, it makes sense since such stations also compete with
other stations that are further away but passed by many of the same
drivers on the same route (e.g., during their daily commute).
Table 4: Effect of MPD under different
supply-side conditions
Gasoline
Diesel
Gasoline
Diesel
Gasoline
Diesel
(1)
(2)
(3)
(4)
(5)
(6)
MPD
-0.022\(^{***}\)
-0.020\(^{***}\)
-0.024\(^{***}\)
-0.022\(^{***}\)
-0.023\(^{***}\)
-0.021\(^{***}\)
(0.0003)
(0.0004)
(0.0002)
(0.0002)
(0.0002)
(0.0002)
MPD\(\times\)1 Rival
-0.000
-0.000
(0.0004)
(0.0005)
MPD\(\times\)2 Rivals
-0.001\(^{**}\)
-0.001\(^{**}\)
(0.0004)
(0.0005)
MPD\(\times\)3 Rivals
-0.002\(^{***}\)
-0.002\(^{***}\)
(0.0004)
(0.0005)
MPD\(\times\)4 Rivals
-0.001\(^{***}\)
-0.001\(^{**}\)
(0.0004)
(0.0005)
MPD\(\times\)5+ Rivals
-0.003\(^{***}\)
-0.002\(^{***}\)
(0.0003)
(0.0004)
MPD\(\times\)Integrated
0.000
0.000
(0.0002)
(0.0002)
MPD\(\times\)Oligopolist
-0.001\(^{***}\)
-0.002\(^{***}\)
(0.0002)
(0.0002)
Date FE
Yes
Yes
Yes
Yes
Yes
Yes
Station FE
Yes
Yes
Yes
Yes
Yes
Yes
Observations
6,256,789
7,141,675
6,256,789
7,141,675
6,256,789
7,141,675
Columns (1) and (2) present estimates of the effect of MPD on log
weekly prices for gasoline and diesel, respectively, interacted with the
number of competitors in a 5 km radius around the focal station. Columns
(3) and (4) present the results for the interaction of MPD with an
indicator for whether a station is integrated. Columns (5) and (6)
present the results for the interaction of MPD with an indicator for
whether the station belongs to an oligopolist. The observation period is
from 15 April 2013 to 31 March 2014. Standard errors are clustered at
the station level and are reported in parentheses. \(^{*}\)\(p<0.10\), \(^{**}\)\(p<0.05\), \(^{***}\)\(p<0.01\)
We also investigate the role of vertical integration and of
oligopoly. We find no statistically significant difference in the effect
of MPD between vertically integrated and nonintegrated stations.
However, we do find a stronger effect of MPD on the subset of stations
that the German Federal
Cartel Office (2011) classified as vertically integrated
oligopolists. Though small in magnitude (approximately 10% of the
overall treatment effect), this is an encouraging finding for this
particular policy measure, as its aim was to rein in some of the market
power allegedly held by these oligopolists.
Effect of follow-on radio
reports
In Table 5, we report the results from a
regression of the logarithm of prices on our indicators for stations in
the reception areas for local radio reports about fuel prices. Columns
(1) and (2) present the results of the effect of reports by Extra-Radio
and Radio Arabella on gasoline prices and Columns (3) and (4) for
diesel.
Table 5: Effect of radio reports on log gross
prices
Gasoline
Diesel
(1)
(2)
(3)
(4)
Treatment group:
Extra-Radio
Arabella
Extra-Radio
Arabella
Radio reports
0.003
-0.002\(^{***}\)
0.002
-0.005\(^{***}\)
(0.0026)
(0.0004)
(0.0024)
(0.0004)
Date FE
Yes
Yes
Yes
Yes
Station FE
Yes
Yes
Yes
Yes
Observations
350,655
452,481
355,928
457,559
Adjusted \(R^{2}\)
0.694
0.705
0.625
0.643
Notes: There are 70 fuel stations in the reception area of
Extra-Radio and 585 fuel stations in the reception area of Radio
Arabella. Columns (1) and (3) compare log prices for gasoline and
diesel, respectively, at fuel stations in the reception areas of
Extra-Radio with those at other fuel stations in Bavaria before and
after the beginning of the radio reports. Columns (2) and (4) do the
same for the stations in the reception areas of Radio Arabella. Standard
errors clustered at the fuel station level are in parentheses. \(^{*}\)\(p<0.10\), \(^{**}\)\(p<0.05\), \(^{***}\)\(p<0.01\)
We find that whereas reports by Radio Arabella lead to lower fuel
prices, this is not the case for Extra-Radio. There are several
plausible explanations for why this is the case. First, Radio Arabella
has a listenership of approximately \(100,000\) listeners on average per hour and
reaches 14% of the population above age 14 in and around Munich, while
Extra-Radio has approximately \(10,000\) listeners on average per hour and
reaches 9% of the population above age 14 in and around Hof ((Kantar
2018)).The
average listenership per hour refers to weekdays between 6 am and 6
pm. Whereas Radio Arabella is the most listened-to local radio
station in the Bavarian capital, Extra-Radio is the second most
listened-to radio station in Hof.
Second, the reception area of Extra-Radio lies on the border of the
Czech Republic, where fuel is approximately 20 eurocents cheaper. Radio
reports about the cheapest fuel station on the German side might
therefore be less relevant for price-sensitive consumers.
A second finding is that the price effect on diesel is larger than
that on gasoline. Through the lens of the stylized model, this should be
the case when the effect of a larger price decrease from a marginal
increase in \(\mu\) in markets with a
higher \(\mu_0\) is quantitatively more
important than the effect of a larger increase in the share of informed
consumers in response to a marginal decrease in clearinghouse access
costs.
Overall, we find that follow-on radio reports can intensify the
treatment effect and lead to a further decrease in prices.
Discussion and policy implications
When and how can mandatory price disclosure policies be used to lower
prices? We synthesize the results from our analysis with findings in the
literature to identify key factors that determine the effect of MPD. We
begin by discussing factors that may help assess whether MPD is likely
to benefit consumers in a particular setting. Then, we discuss how the
design of MPD can help make it successful.
Prior consumer information. The larger price effect
of MPD for gasoline than for diesel suggests that the effect of
increasing price transparency is larger in populations that are
relatively less informed ex ante. This seems quite logical if one
considers the need for at least some consumers to be uninformed for the
price information to turn uninformed consumers into informed ones. The
more uninformed consumers there are, the more consumers can potentially
be converted into informed consumers by MPD. There is one important
qualification: although the presence of uninformed consumers is a
prerequisite for MPD to benefit consumers, it is not sufficient for this
to occur. As we discuss below, it is also important to gauge whether
previously uninformed consumers will take advantage of this new
information.
Prior seller information. Though Green and Porter (1984)
show theoretically that collusion can be stable even under imperfect
observability of the actions of rivals, improving this observability
makes the need for low-price punishment phases rarer and therefore
increases prices. Empirically, Albæk et al. (1997) show how an increase
in price transparency among producers in the Danish ready-mix concrete
industry facilitated price coordination and led to higher prices. Byrne and
de Roos (2019) show that (tacit) coordination occurs in
retail fuel markets, and Luco (2019) finds that prices in the
Chilean retail fuel market increased after MPD.
Despite the negative findings in other settings, we find that MPD in
Germany decreased prices. A major difference between our setting and the
Danish ready-mix concrete industry or the Chilean retail fuel market is
that price transparency in Germany was already very high before MPD. The
German Federal Cartel
Office (2011) notes that price transparency pre-MPD was highly
asymmetric: Whereas consumers and independent fuel stations had to incur
high search costs to learn about prices, the vertically integrated
oligopolists had employees at their own fuel stations and at franchisee
stations report local competitor prices to the oligopolists multiple
times per day. This suggests that the limited risk of increasing price
transparency for sellers was a crucial success factor.
A flip-side implication of this could be that there are benefits to
limiting price transparency on the seller side. Here, a cautionary tale
is offered by Wu
(2023). They show that when the Informed Sources
antitrust case in the Australian retail gasoline market led to one
player’s being excluded from the price information sharing facility
(whereas its prices were still observable by the other players), the
asymmetric information sharing let the excluded player credibly commit
to higher prices and increased equilibrium prices and profits.
Supply-side factors. Our empirical results show that
supply-side factors play a role in mediating the effect of MPD. Although
we find that even local monopolists reduced their prices in response to
MPD since they compete with other stations further away but on drivers’
same route, we find that, the more local competitors there are, the
higher is the price reduction in response to MPD. Relatedly, Schmidt-Dengler (2023)
find that entry by a new station in a local retail fuel market decreases
prices, especially at the lower end of the local price
distribution.Haucap, Heimeshoff, and
Siekmann (2017) find that fuel stations with more local
competitors tend to have more heterogeneous prices.
Another finding is that oligopolist stations reduced their prices
more than other stations. To the extent that the former enjoyed higher
margins pre-MPD, this seems plausible since a price decrease requires a
margin for the station to absorb this decrease without incurring losses.
An obvious takeaway is that for MPD to lead to price decreases, there
needs to be supracompetitive prices pre-MPD. More importantly, however,
it seems that using MPD to lower prices works better in markets with
more competitors.
Price dispersion. A post-MPD increase in price
dispersion, as measured by the VOI, is not a sign of failure of the
policy. Although it might seem intuitive that the VOI should decrease if
MPD is to lower prices, the stylized model shows that a marginal
increase in the share of informed consumers can lead to an increase in
the VOI while at the same time decreasing the price paid by informed and
uninformed consumers.
Information uptake. As noted by Wu (2023), a second
remedy by the Australian Competition and Consumer Commission (ACCC) in
the Informed Sources case was that the price information would
have to be made available to third parties “on reasonable commercial
terms.” Wu (2023)
note that there was no entry from price comparison apps through this
channel. They explain that there already existed an incumbent price
comparison app relying on consumer-reported prices but that even this
app had very low adoption rates. Luco (2019) also reports that, in Chile,
where MPD softened competition, consumer search after MPD remained low.
On average, there were only \(87\)
search requests within a 1 km radius of a station per month.
In contrast, adoption of price comparison apps in Germany was high.
For the three apps for which we can report aggregate usage statistics in
Figure A.1 (out of the 44 apps and
websites registered to connect to the MTU’s database), there were more
than 70 million monthly page impressions in December 2014. Information
uptake appears to play an important role in the price effects of MPD.
Before introducing MPD, policymakers could gauge consumers’ willingness
to use this information through surveys or their use of price comparison
apps in other markets and check whether the conditions necessary for the
adoption of the price information (e.g., widespread smartphone adoption,
availability of mobile internet on driving routes) are fulfilled.
Low entry barriers for consumer apps. Whereas low
expected adoption by consumers might have deterred Australian app
developers from creating fuel price comparison apps, another reason for
such a dearth of new apps could be barriers to entry. The ACCC’s mandate
that Informed Sources make the data available “on reasonable
commercial terms” suggests that app developers would have to pay for
data access, allowing Informed Sources to create administrative
barriers to entry. In contrast, the GFCO set up the MTU, which allows
any app developer interested in diffusing this information to request
registration. The only requirement is that applicants describe how the
data will be used to inform consumers. In December 2013, three months
after the start of MPD, there were 9 registered apps and websites. A
year later, in December 2014, there were 44 registered apps and
websites. Ten years later, in December 2023, there remain 43 registered
apps and websites. Low barriers to entry for app developers thus appear
to facilitate the creation of such apps.
Maintain attention. What else could policymakers do
to encourage consumers to search? In Figure 8, we
show that the MPD-induced price decrease was strongest a few months
after the policy was launched and then prices stabilized at a lower
level. This coincided with a drop in public attention to MPD. Our
finding of a persistent long-term effect of MPD after attention to MPD
was high in its initial phase is in line with what Byrne and
de Roos (2022) dub “startup search costs”. A large
exogenous shock to consumers’ search incentives (in their case a
temporary increase in price dispersion) can lead to a persistent
increase in price search even when this incentive subsides. In the case
of MPD, this means that a temporary increase in attention to the
availability of price comparison apps (e.g., through a temporary
information campaign) can change habits and permanently increase such
apps’ usage beyond their counterfactual level had the information been
made available without an information campaign.
Our results on the price effects of follow-on radio reports suggest
that such information campaigns can have an impact on local prices and
lead to a price decrease beyond the effect of simply making price data
available. Taken together, these results indicate that information
campaigns that remind consumers of the existence of price comparison
apps or present them with the price information itself could lead to
further permanent price decreases.
Limited price display. The price disclosure policies
in Australia, Chile and Germany have the aim of diffusing information
about all prices to consumers. Martin (Forthcoming) studies an
alternative design used in Austria, where only the lowest 50% of fuel
prices in a local market are displayed. He uses price data for Germany
and a model with endogenous search and pricing to study what share of
prices displayed to consumers leads to the lowest price level. He finds
that showing all prices is not optimal for consumers and that showing
only the lowest 20% of prices maximizes consumer welfare.
Overall, he finds an inverse U-shaped relationship between price
transparency and consumer welfare. This inverse U-shaped relationship
arises from two effects that can go in opposite directions: First, there
is a matching effect, where consumers would like to be matched
with the best station for them on the basis not only of price but also
of other characteristics such as travel distance. Not showing the price
at a particularly close station with a price just outside the range of
the lowest-price stations can harm consumers. Second, there is an
attention effect. Limiting the share of prices shown induces
sellers to compete more intensely to be included in the displayed
results. Whereas the exact share of prices that should be displayed to
maximize consumer welfare will depend on the particular application and
parameter values, the study holds an important message for policymakers.
Limiting the share of prices displayed can magnify the effect of MPD on
consumers beyond that of a full-information design.
Conclusion
The aim of the paper is to shed light on what factors lead mandatory
price disclosure to be beneficial to consumers. We specify a stylized
model featuring homogeneous good sellers and buyers who are uninformed
about prices but can purchase access to an information clearinghouse. We
use the model to simulate how market conditions mediate the effect of
MPD.
We complement this with an empirical analysis of the introduction of
MPD in the German retail fuel market. A key feature of the setting is
that we have granular station-level prices from before and after the
policy change and for a control country. Another key feature is that
variation in fuel types, the number of sellers, and complementary
information campaigns allow us to conduct a rich study of
mechanisms.
We find that MPD in the German retail fuel market reduced price
dispersion and the overall price level. It was particularly successful
in markets with a lower share of ex ante informed consumers, in markets
with a higher number of sellers, and when accompanied by complementary
information campaigns.
Although our results, together with other findings in the literature,
paint a much clearer picture of when we should expect MPD to benefit
consumers, there is still much scope for future research. In particular,
empirical applications in which there exist more direct measures of how
MPD affects the share of informed consumers could help shed further
light on the mechanisms underlying its effects.
Data Availability
Code and data for replicating the tables and figures in this article
can be found in Montag et
al. (2024) in the Harvard Dataverse
(https://doi.org/10.7910/DVN/HI5TPV). The replication package contains a
README file detailing the data sources, computational requirements, and
structure of the replication code.
s
Online Appendix: When Does Mandatory Price Disclosure Lower
Prices? Evidence from the German Fuel Market
Felix Montag, Alina Sagimuldina and Christoph Winter
Notes: The figure shows simulations of the VOI and the
clearinghouse access costs by the share of informed consumers.
The clearinghouse access costs are for the marginal consumer if all
consumers with lower costs purchase clearinghouse access. We use the
following parameter values in the simulations: \(\upsilon = 1\), \(\lambda = 0.2\), and a uniform distribution
of access costs between \(0\) and \(1\) for all nonshoppers. Panel A
uses \(N = 2\), Panel B uses \(N = 3\), Panel C uses \(N = 5\), and Panel D uses \(N = 10\).
Figure A.3: VOI and clearinghouse access
costs by share of informed consumers
A. \(N = 2\)
B. \(N = 3\)
C. \(N = 5\)
D. \(N = 10\)
Notes: The figure shows simulations of the VOI and the
change in \(E[p]\) and \(E[p_{min}]\) for a marginal increase in
\(\mu\) by the share of
informed consumers. We use \(\upsilon
= 1\) in all simulations. Panel A uses \(N = 2\), Panel B uses \(N = 3\), Panel C uses \(N = 5\), and Panel D uses \(N = 10\).
Figure A.4: VOI and marginal price effect
by share of informed consumers
Retail margins and fuel station
characteristics in Germany
Figure A.5 shows the
distribution of fuel stations in Germany over our sample period. Fuel
stations are spread across the country and clustered around urban
areas.
Note: The figure shows the geographic distribution of fuel stations
in Germany.
Figure A.5: Distribution of fuel stations
across Germany
Table 6 shows the share of stations in
Germany by brand and the share of nonintegrated stations before and
after the introduction of MPD. Overall, the brand composition before and
after MPD is very similar.
Table A.1: Share of stations in percent by
brand
Pre-MTU
Post-MTU
Aral
21.1
18.1
Shell
13.9
14.2
Esso
5.1
5.3
Total
7.3
4.6
Jet
5.2
4.6
Orlen
4.9
4.2
Agip
1.8
3.1
Hem
3.2
2.8
OMV
2.7
2.3
Nonintegrated
34.9
41.0
Notes: The “Pre-MPD” column shows the share of fuel stations by brand
in the sample for Germany before the introduction of the MPD. The
“Post-MPD” column shows the corresponding share after the introduction
of MPD. We consider all fuel stations with at least one price entry in
the sample before and after the launch of MPD, respectively.
Although there are no restrictions on the number of times fuel
stations can change prices in France or Germany, there are strong
differences in the number of times they actually do so. Whereas fuel
stations in Germany changed their prices on average four times a day
over our observation period, French fuel stations changed prices less
than once a
day.This
is consistent with findings by Haucap, Heimeshoff, Kehder, et al.
(2017) for Germany and Gautier and Saout (2015) for
France. Since we do not observe volume data, we cannot compute
volume-weighted average fuel prices or retail margins over the day. We
can thus either pick a particular time of day at which to measure prices
and margins or calculate a simple average of prices and margins at
different times of the day. Since fuel prices in France stay fairly
constant during the day, either approach should lead to a similar result
for France. The frequent price changes in Germany, however, make it
important to select the right time for which to calculate fuel prices
and retail margins.
We choose to use prices at 5 pm in our analysis, and we construct
stations’ retail margins based on these prices. A representative survey
among motorists commissioned by the German Ministry for Economic Affairs and Energy
(2018) in 2016 found that approximately 60% of respondents buy
fuel between 4 pm and 7 pm, of which two-thirds buy fuel between 5 pm
and 6 pm. At the same time, less than 5% of respondents buy fuel before
10
am.The
daily fueling patterns are described in detail in Figure A.9 in Appendix 11.1. The German Ministry for Economic
Affairs and Energy (2018) furthermore documents daily price
cycles with high prices in the morning, which fall over the day and rise
again in the evening around 8
pm.This
is consistent with the pricing patterns in the data described in Figure
[app fig_tr: price
patterns] in Appendix 11.1. This suggests
that consumers are aware of these price cycles and fuel during the
low-price period in the late
afternoon.There
were numerous newspaper articles on intertemporal price dispersion
published during our observation period, which suggest that consumers
are aware of these patterns. To gauge the effect of introducing
mandatory price disclosure on consumers, it is therefore sensible to
focus on fuel prices and retail margins at times where consumers buy
fuel in large volumes.
To construct retail margins based on prices at 5 pm, first, we
subtract taxes and levies to compute net fuel prices. Second, we
subtract daily market prices for refined oil at the port of Rotterdam to
obtain a proxy for retail margins. In Germany, taxes and levies include
a lump-sum energy tax, a value-added tax, and an oil storage levy per
liter of fuel. In 2013 and 2014, the lump-sum energy tax was 65.45
eurocents per liter for gasoline and 47.04 for diesel. The oil storage
levy was at 0.27 eurocents per liter for gasoline and 0.30 eurocents per
liter for diesel. The value-added tax rate was
19%.See
https://en2x.de/wp-content/uploads/2021/11/MWV_Mineraloelwirtschaftsverband-e.V.-Jahresbericht-2020.pdf
and https://www.ebv-oil.org/cms/cms2.asp?sid=77&nid=&cof=75.
In France, fuel products are subject to a lump-sum tax. In 2013 and
2014, the lump-sum tax was between 40 and 62 eurocents per liter,
depending on the metropolitan region and fuel
type.See
https://www.douane.gouv.fr/la-douane/informations/bulletins-officiels-des-douanes.
In addition, the VAT rate in mainland France was 19.6% in 2013 and 20%
in 2014. We exclude fuel stations located outside mainland France from
our analysis.
In the SDID estimation, we use weekly fuel prices. We compute the
weekly fuel prices by averaging Monday–Friday prices at 5 pm. We exclude
weekend prices from the analysis.
Figure A.6 shows the daily number
of fuel stations for which the price panel contains a price entry at 5
pm. There is no structural break in the daily number of fuel stations
for which there is an entry in the price panel before and after the MPD
introduction. For most days in the pre-MPD period, we have prices for
approximately \(12,000\) fuel stations
in our panel. This number stays approximately the same for the period
after the introduction of MPD and increases only to approximately \(13,500\) for the period from the end of
February 2014, when the reporting issues of Total and Esso
stopped.Total
and Esso reported as normal in October 2013. Esso reported only a very
limited number of prices between November 2013 and mid-February 2014.
Total reported only a very limited number of prices between December
2013 and mid-February 2014. Both experienced reporting issues in April
2014, after which they returned to full reporting. At any point
in time over the observation period, our panel therefore includes prices
for most of the approximately \(14,700\) fuel stations in Germany.
Notes: The figure shows the average daily number of fuel stations
with a positive price report at 5 pm in Germany in our sample.
Figure A.6: Number of fuel stations with
positive price reports at 5pm
Figure A.7 shows fewer price
changes per day in our data prior to MPD than after MPD was introduced.
This is because whereas for the period after the introduction of MPD we
observe the universe of price changes in Germany, for the period before
MPD we observe only the subset of prices reported by users to the
app.
Notes: The figure shows the average daily number of price changes in
Germany in our data. In the pre-MPD period, consecutive reports of the
same price are not considered a price change.
Figure A.7: Number of daily price
changes
Figure [app fig_tr:
notification patterns] shows the number of notifications of price
changes over the day before and after the introduction of MPD. Whereas
before MPD there was a notification every time a user of the app
reported a price, under MPD there is a notification every time there is
a price change.
Pre-MPDPost-MPD
Notes: Panel (a) shows the share of price notifications in our data
set for every hour of the day for the pre-MPD period. Panel (b) shows
the share of price notifications in our data set for every hour of the
day for the post-MPD period. Pre-MPD, each price report by users
notifying the information service provider of a price change is a price
notification. Post-MPD, each price change reported by fuel stations to
the MTU is a price notification.
Figure A.8: Notification patterns over the day
Figure A.9 shows the hourly
fueling patterns as reported in a representative survey among drivers
commissioned by the German Federal Ministry of Economic Affairs. As
discussed in Section 3, the
majority of drivers buy fuel between 5 pm and 7 pm, whereas only very
few drivers buy fuel in the morning.
Notes: The figure shows the average fueling patterns of German
motorists over the day. Data are based on a representative survey of
drivers commissioned by the German Federal Ministry of Economic
Affairs.
Figure A.9: Daily fueling
patterns
The fueling patterns are also consistent with the price patterns
reported in Figure [app fig_tr: price
patterns]. Whereas gasoline and diesel prices are highest in the
morning, they fall during the day until the early evening and start
rising again around 8 pm.
GasolineDiesel
Notes: Panel (a) shows the average gasoline price for every hour
between 7 am and 8 pm in Germany between 2013 and 2014. Panel (b) shows
the average diesel price for every hour between 7 am and 8 pm in Germany
between 2013 and 2014.
Figure A.11 shows that there are no
systematic differences in the average number of daily searches per
unique user for diesel and gasoline prices. There are therefore no
intensive margin differences in search between fuel types.
Notes: The figure shows the daily number of price searches by fuel
type on a major German smartphone app per 1,000 diesel or gasoline
vehicles in circulation. The data are from January to May and October to
December 2015. The solid line corresponds to the search intensity for
diesel. The dashed line corresponds to the search intensity for
gasoline.
Figure A.11: Average daily number of
searches per user by fuel type, post-MPD (Germany)
In this section, we provide further empirical evidence on the average
effect of MPD on gasoline and diesel prices in Germany. It shows that
our results in Section 6 are
robust under alternative specifications.
Difference-in-differences analysis
Since SDID estimation requires a balanced panel, we additionally
report the average treatment effect of MPD on log gross fuel prices
using difference-in-difference analysis based on the full, unbalanced
panel. Specifically, we estimate the following model:
\[\begin{equation}
\tag{4}
\label{eq_tr: did}
Y_{it} = \beta_0 + \beta_1 MPD_{it} + \mu_{i} + \gamma_{t} +
\epsilon_{it},
\end{equation}\] where \(Y_{it}\) corresponds to the log gross fuel
price at station \(i\) at date \(t\) and \(MPD_{it}\) is a dummy equal to one if a
fuel station \(i\) has to report its
prices to the MTU at date \(t\). This
requirement has applied to all fuel stations in Germany since 1 October
2013. \(\mu_{i}\) is fuel station fixed
effects, and \(\gamma_t\) is date fixed
effects.
Table A.2: Effect of MPD on log gross prices
Gasoline
Diesel
Gasoline
Diesel
(1)
(2)
(3)
(4)
MPD
-0.030\(^{***}\)
-0.024\(^{***}\)
-0.031\(^{***}\)
-0.028\(^{***}\)
(0.0002)
(0.0002)
(0.0007)
(0.0005)
Date FE
Yes
Yes
Yes
Yes
Station FE
Yes
Yes
Yes
Yes
Observations
4,128,742
4,727,297
359,372
389,625
Adjusted \(R^{2}\)
0.831
0.806
0.815
0.744
Notes: Columns (1) and (2) present estimates of the effect of MPD on
log daily prices for gasoline and diesel, respectively, using all fuel
stations in Germany and France. Columns (3) to (4) present the same
estimates for a restricted sample of fuel stations 20 to 100 km from the
France–Germany border. The observation periods is from 15 April 2013 to
31 March 2014. Standard errors are clustered at the fuel station level
and are reported in parentheses. \(^{*}\)\(p<0.10\), \(^{**}\)\(p<0.05\), \(^{***}\)\(p<0.01\)
Table 7 reports the effects of MPD
estimated with Equation (4). The outcome variable in
all columns is log gross prices, and the estimation is based on data
from 15 April 2013 to 31 March 2014. The results in Columns (1) and (2)
of Table 7 are based on the full, unbalanced
panel. Columns (3) and (4) report estimates when we use only data on
stations located within 20 to 100 km of the France–Germany border.
Table 7 shows that the introduction of
MPD led to a decline in prices of 3.0% to 3.1% for gasoline and 2.4% to
2.8% for diesel. The effects are economically and statistically
significant and, similarly to the SDID results, remain larger for
gasoline.
Daily average prices weighted by hour
We repeat the estimation of the parameters in Equation (1) using daily average
prices weighted by the share of consumers refueling at that particular
hour as reported in Figure A.9.
Table A.3: Effect of MPD on log daily weighted
average price
Gasoline
Diesel
Gasoline
Diesel
(1)
(2)
(3)
(4)
MPD
-0.024\(^{***}\)
-0.014\(^{***}\)
-0.025\(^{***}\)
-0.014\(^{***}\)
(0.0004)
(0.0004)
(0.0009)
(0.0013)
95% Confidence interval
[-0.025, -0.023]
[-0.015, -0.013]
[-0.027, -0.023]
[-0.016, -0.011]
Week FE
Yes
Yes
Yes
Yes
Station FE
Yes
Yes
Yes
Yes
Observations
647,500
768,550
50,400
56,500
Notes: Columns (1) and (2) present estimates of the effect of MPD on
log weekly prices for gasoline and diesel, respectively, using all fuel
stations in Germany and France. Columns (3) to (4) present the same
estimates for a restricted sample of fuel stations 20 to 100 km from the
France–Germany border. The observation period is from 15 April 2013 to
31 March 2014. We compute the daily average weighted price by weighting
the hourly prices by the share of consumers refueling at a particular
time as reported in Figure A.9. Standard errors
computed from 200 bootstrap draws are reported in parentheses. \(^{*}\)\(p<0.10\), \(^{**}\)\(p<0.05\), \(^{***}\)\(p<0.01\)
The results in Table 8 show that
the differences in the effect of MPD between fuel types are not
sensitive to our decision to use prices at 5 pm.
Donut SDID analysis
Figure A.12 illustrates the
identification strategy for the donut SDID analysis graphically. To
compare stations in economic regions that are as comparable as possible
across countries, we restrict the panel to stations within 100 km of the
France–Germany border. Fuel stations less than 20 km from the border are
not considered because these could be in direct competition with each
other and so spillovers of the treatment effect could occur, threatening
the stable unit treatment value assumption. Each point in Figure A.12 thus represents a fuel
station in either France or Germany that is 20 to 100 km from the
border.
Notes: The thick solid line represents the France–Germany border.
Each point to the right of the border represents a fuel station in
Germany that is 20 to 100 km from the border. Each point to the left of
the border represents a fuel station in France that is 20 to 100 km from
the border. These are the fuel stations considered in our donut SDID
analysis, when they have no missing weekly price observations.
Figure A.12: Fuel stations 20 to 100 km
from the France–Germany border
Table A.4: Effect of MPD on log gross prices
under alternative donuts
Gasoline
Diesel
Gasoline
Diesel
Gasoline
Diesel
(1)
(2)
(3)
(4)
(5)
(6)
MPD
-0.032\(^{***}\)
-0.021\(^{***}\)
-0.029\(^{***}\)
-0.018\(^{***}\)
-0.028\(^{***}\)
-0.018\(^{***}\)
(0.002)
(0.002)
(0.002)
(0.002)
(0.001)
(0.001)
95% CI
[-0.034, -0.029]
[-0.026, -0.017]
[-0.033, -0.026]
[-0.022, -0.015]
[-0.031, -0.026]
[-0.021, -0.016]
Week FE
Yes
Yes
Yes
Yes
Yes
Yes
Station FE
Yes
Yes
Yes
Yes
Yes
Yes
Observations
9,550
11,900
21,200
25,250
37,950
43,600
Columns (1) and (2) present estimates of the effect of MPD on log
weekly prices for gasoline and diesel, respectively, using a restricted
sample of fuel stations 20 to 40 km from the France–Germany border.
Columns (3) and (4) present the same estimates for fuel stations 20 to
60 km from the border. Columns (5) and (6) present the same estimates
for fuel stations 20 to 80 km from the border. The observation periods
is from 15 April 2013 to 31 March 2014. Standard errors computed from
200 bootstrap draws are reported in parentheses. \(^{*}\)\(p<0.10\), \(^{**}\)\(p<0.05\), \(^{***}\)\(p<0.01\)
In Table 9, we re-estimate
the donut SDID regression for the analysis period 15 April 2013 until 31
March 2014 using different distances to the France–Germany border. We
find that the results are robust to our changing the distance threshold
and that the average effect of MPD is always larger for gasoline.
Estimation with control for crude
oil price
As discussed in Section 5, the
crude oil price experienced a sizable decline in the second half of
2014. The fluctuations in the price of crude oil could bias our
estimates of the MPD effects if input costs were passed through
differentially between stations in Germany and France. Even though we
restrict our analysis to August 2014 in our main empirical
specification, we additionally estimate the effect of MPD by directly
allowing for differential pass-through of oil cost shocks between
stations in Germany and France.
Table 10 shows the effect of MPD
on the log gross weekly average gasoline and diesel price when we
control for an indicator for stations in Germany interacted with the
crude oil price at the port of Rotterdam. Columns (1) and (2) use the
full balanced panel, and Columns (3) and (4) restrict the sample to
stations located within 20 to 100 km of the France–Germany border. The
effects are estimated via SDID, and all columns use data from between 15
April 2013 and 31 March 2014. In addition to allowing for differential
pass-through of input cost shocks between stations in Germany and
France, we include fuel station and time fixed effects.
Table A.5: Effect of MPD on log gross prices
Gasoline
Diesel
Gasoline
Diesel
(1)
(2)
(3)
(4)
MPD
-0.027\(^{***}\)
-0.018\(^{***}\)
-0.029\(^{***}\)
-0.019\(^{***}\)
(0.0004)
(0.0005)
(0.0011)
(0.0014)
95% confidence interval
[-0.028, -0.026]
[-0.019, -0.017]
[-0.032, -0.027]
[-0.022, -0.016]
Germany \(\times\) crude oil price
Yes
Yes
Yes
Yes
Week FE
Yes
Yes
Yes
Yes
Station FE
Yes
Yes
Yes
Yes
Observations
647,500
768,550
50,400
56,500
Notes: Columns (1) and (2) present estimates of the effect of MPD on
log weekly prices for gasoline and diesel, respectively, using all fuel
stations in Germany and France. Columns (3) and (4) present the same
estimates for a restricted sample of fuel stations 20 to 100 km from the
France–Germany border. The observation period is from 15 April 2013 to
31 March 2014. We control for the interaction of an indicator for
Germany with the crude oil price at the port of Rotterdam. Standard
errors computed from 200 bootstrap draws are reported in parentheses.
\(^{*}\)\(p<0.10\), \(^{**}\)\(p<0.05\), \(^{***}\)\(p<0.01\)
Columns (1) and (2) in Table 10
show that the introduction of mandatory price disclosure led to a
decrease in weekly average prices of \(2.7\%\) for gasoline and \(1.8\%\) for diesel. When we restrict to the
donut SDID sample, the corresponding estimates indicate a decline of
\(2.9\%\) for gasoline and \(1.9\%\) for diesel. Overall, the magnitude
of the MPD effect and its ranking with respect to the two fuel types
remain robust to our allowing for differential pass-through of the crude
oil price between stations in Germany and France.
Effect of MPD on retail margins
Table 11 shows the effects of MPD on
retail margins, as estimated with the SDID model in Equation (1). The outcome variable in
all columns is weekly average retail margins, and the estimation is
based on data from 15 April 2013 to 31 March 2014. All columns include
fuel station and week fixed effects.
The results in Columns (1) and (2) show that mandatory price
disclosure led to a decrease in weekly average retail margins of \(3.4\) and \(1.8\) eurocents for gasoline and diesel,
respectively. In Columns (3) and (4), we restrict the analysis to
stations within 20 to 100 km of the France–Germany border. Using this
donut SDID, Columns (3) and (4) show that, after MPD, weekly average
retail margins declined by \(3.7\)
eurocents for gasoline and \(2.0\)
eurocents for diesel. The effect of MPD is statistically and
economically significant and is larger for gasoline.
Table A.6: Effect of MPD on retail margins in
eurocents
Gasoline
Diesel
Gasoline
Diesel
(1)
(2)
(3)
(4)
MPD
-3.346\(^{***}\)
-1.786\(^{***}\)
-3.661\(^{***}\)
-2.043\(^{***}\)
(0.044)
(0.047)
(0.141)
(0.157)
95% confidence interval
[-3.431, -3.261]
[-1.878, -1.693]
[-3.937, -3.384]
[-2.351, -1.735]
Week FE
Yes
Yes
Yes
Yes
Station FE
Yes
Yes
Yes
Yes
Observations
647,500
768,550
50,400
56,500
Mean retail margin
8.40
10.79
8.55
11.23
Notes: Columns (1) and (2) present estimates of the effect of MPD on
weekly average retail margins for gasoline and diesel, respectively,
using all fuel stations in Germany and France. Columns (3) and (4)
present the same estimates for a restricted sample of fuel stations 20
to 100 km from the France–Germany border. The observation periods is
from 15 April 2013 to 31 March 2014. Standard errors computed from 200
bootstrap draws are reported in parentheses. \(^{*}\)\(p<0.10\), \(^{**}\)\(p<0.05\), \(^{***}\)\(p<0.01\)
Difference-in-differences
analysis: European countries as control
To test the validity of France as a counterfactual, we also estimate
the effect of MPD on fuel prices in Germany using 26 other European
countries as a control
group.Austria,
Belgium, Bulgaria, Croatia, Cyprus, Czechia, Denmark, Estonia, Finland,
France, Greece, Hungary, Ireland, Italy, Latvia, Lithuania, Luxembourg,
Malta, Netherlands, Poland, Portugal, Romania, Slovakia, Slovenia,
Spain, and Sweden form the control group. To do so, we use
information on country-level weekly average net gasoline and diesel
prices as reported by the European Commission in its Weekly Oil
Bulletin.
Table 12 shows the
effects of MPD on the logarithm of net gasoline and diesel prices, as
estimated with a difference-in-differences strategy. As in our main
analysis, the estimation is based on data from between 15 April 2013 and
31 March 2014, and we include week and country fixed effects in all
columns. In Columns (3) and (4), we additionally control for the crude
oil price at the port of Rotterdam interacted with country indicators,
which allows for differential pass-through of oil cost shocks across
countries.
Table 12 shows that,
when we use other European countries as our control group, we find that
MPD led to a decline of 3.0% to 3.3% for gasoline and 1.5% to 1.8% for
diesel. The ranking of the effects with respect to the fuel types and
their magnitude remain robust to our using this alternative control
group.
Table A.7: Effect of MPD on log net prices
Gasoline
Diesel
Gasoline
Diesel
(1)
(2)
(3)
(4)
MPD
-0.033\(^{***}\)
-0.018\(^{***}\)
-0.030\(^{***}\)
-0.015\(^{***}\)
(0.003)
(0.003)
(0.006)
(0.005)
Country \(\times\) crude oil price
No
No
Yes
Yes
Date FE
Yes
Yes
Yes
Yes
Country FE
Yes
Yes
Yes
Yes
Observations
1,258
1,258
1,258
1,258
Adjusted \(R^{2}\)
0.868
0.836
0.879
0.860
Notes: Columns (1) and (2) present estimates of the effect of MPD on
log net prices for gasoline and diesel, respectively, using Germany as a
treatment group and all other EU countries as the control group. Columns
(3) to (4) present additional interactions between the crude oil price
and an indicator variable for each country. Robust standard errors are
reported in parentheses. \(^{*}\)\(p<0.10\), \(^{**}\)\(p<0.05\), \(^{***}\)\(p<0.01\)
References
Albæk, Svend, Peter Møllgaard, and Per B. Overgaard. 1997.
“Government-Assisted Oligopoly Coordination? A Concrete
Case.”The Journal of Industrial Economics 45 (4):
429–43.
Arkhangelsky, Dmitry, Susan Athey, David A. Hirshberg, Guido W. Imbens,
and Stefan Wager. 2021. “Synthetic
Difference-in-Differences.”American Economic Review 111
(12): 4088–118.
Assad, Stephanie, Robert Clark, Daniel Ershov, and Lei Xu. 2024.
“Algorithmic Pricing and Competition: Empirical Evidence from the
German Retail Gasoline Market.”Journal of Political
Economy 132 (3): 723–71.
Ater, Itai, and Oren Rigbi. 2023. “Price Transparency, Media and
Informative Advertising.”American Economic Journal:
Microeconomics 15 (1): 1–29.
Barron, John M., Beck A. Taylor, and John R. Umbeck. 2004. “Number
of Sellers, Average Prices, and Price Dispersion.”International Journal of Industrial Organization 22: 1041–66.
Brown, Zach Y. 2019a. “An Empirical Model of Price Transparency
and Markups in Health Care.”Mimeo.
Brown, Zach Y. 2019b. “Equilibrium Effects of Health Care Price
Information.”Review of Economics and Statistics 101
(4): 699–712.
Burdett, Kenneth, and Kenneth L. Judd. 1983. “Equilibrium Price
Dispersion.”Econometrica 51 (4): 955–69.
Byrne, David P., and Nicolas de Roos. 2019.
“Learning to Coordinate: A Study in Retail Gasoline.”American Economic Review 109 (2): 591–619.
Byrne, David P., and Nicolas de Roos. 2022.
“Startup Search Costs.”American Economic Journal:
Microeconomics 14 (2): 81–112.
Byrne, David P., and Nicolas de Roos. 2017. “Consumer Search in
Retail Gasoline Markets.”The Journal of Industrial
Economics 65 (1): 183–93.
Carranza, Juan Esteban, Robert Clark, and Jean-François Houde. 2015.
“Price Controls and Market Structure:
Evidence from Gasoline Retail Markets.”Journal of
Industrial Economics 63 (1): 152–98.
Cason, Timothy N., Daniel Friedman, and Ed Hopkins. 2020. “Discrete Prices and the Incidence and Efficiency of
Excise Taxes.”Journal of Political Economy 129
(3): 790–841.
Chandra, Ambarish, and Mariano Tappata. 2011. “Consumer Search and
Dynamic Price Dispersion: An Application to Gasoline Markets.”The RAND Journal of Economics 42 (4): 681–704.
Eckert, Andrew. 2013. “Empirical Studies of Gasoline Retailing: A
Guide to the Literature.”Journal of Economic Surveys 27
(1): 140–66.
Gautier, Erwan, and Ronan Le Saout. 2015. “The Dynamics of
Gasoline Prices: Evidence from Daily French Micro Data.”Journal of Money, Credit and Banking 47 (6): 1063–89.
Genakos, Christos, and Mario Pagliero. 2022. “Competition and
Pass-Through: Evidence from Isolated Markets.”American
Economic Journal: Applied Economics 14 (4): 35–57.
German Federal Cartel Office. 2011. Sektoruntersuchung
Kraftstoffe. German Federal Cartel Office.
German Ministry for Economic Affairs and Energy. 2018. Bericht über Die Ergebnisse Der Arbeit Der
Markttransparenzstelle für Kraftstoffe Und Die Hieraus
Gewonnenen Erfahrungen. German Ministry for Economic Affairs
and Energy.
Green, Edward J., and Robert H. Porter. 1984. “Noncooperative
Collusion Under Imperfect Price Information.”Econometrica 52 (1): 87–100.
Haucap, Justus, Ulrich Heimeshoff, Christiane Kehder, Johannes
Odenkirchen, and Susanne Thorwarth. 2017. “Auswirkungen Der
Markttransparenzstelle für Kraftstoffe (MTS-k):
Änderungen Im Anbieter- Und Nachfragerverhalten.”DICE Ordnungspolitische Perspektiven.
Haucap, Justus, Ulrich Heimeshoff, and Manuel Siekmann. 2017.
“Fuel Prices and Station Heterogeneity on Retail Gasoline
Markets.”The Energy Journal 38 (6): 81–104.
Hosken, Daniel S., Robert S. McMillan, and Christopher T. Taylor. 2008.
“Retail Gasoline Pricing: What Do We Know?”International Journal of Industrial Organization 26: 1425–36.
Houde, Jean-François. 2012. “Spatial Differentiation and Vertical
Mergers in Retail Markets for Gasoline.”American Economic
Review 102 (5): 2147–82.
Kühn, Kai-Uwe, and Xavier Vives. 1995. Information Exchanges Aong
Firms and Their Impact on Competition. Office for Official
Publications of the European Communities, Luxembourg.
Lewis, Matthew. 2008. “Price Dispersion and Competition with
Differentiated Sellers.”The Journal of Industrial
Economics 106 (3): 654–78.
Luco, Fernando. 2019. “Who Benefits from Information Disclosure?
The Case of Retail Gasoline.”American Economic Journal:
Microeconomics 11 (2): 277–305.
Martin, Simon. Forthcoming. “Market Transparency and Consumer
Search - Evidence from the German Retail Gasoline Market.”RAND Journal of Economics, Forthcoming.
Montag, Felix, Robin Mamrak, Alina Sagimuldina, and Monika Schnitzer.
2023. “Imperfect Price Information, Market Power, and Tax
Pass-Through.”George J. Stigler Center for the Study of the
Economy & the State Working Paper No. 337.
Montag, Felix, Alina Sagimuldina, and Christoph Winter. 2024.
“Replication Data for: When Does Mandatory Price Disclosure Lower
Prices? Evidence from the German Fuel Market.”Harvard
Dataverse. https://doi.org/10.7910/DVN/HI5TPV.
Pennerstorfer, Dieter, Philipp Schmidt-Dengler, Nicolas Schutz,
Christoph Weiss, and Biliana Yontcheva. 2020. “Information and
Price Dispersion: Theory and Evidence.”International
Economic Review 61 (2): 871–99.
Petrikaite, Vaiva. 2016. “Collusion with Costly Consumer
Search.”International Journal of Industrial
Organization 44: 1–10.
Rossi, Federico, and Pradeep K. Chintagunta. 2016. “Price
Transparency and Retail Prices: Evidence from Fuel Price Signs in the
Italian Highway System.”Journal of Marketing Research
53 (3): 407–23.
Schmidt-Dengler, Kai Fischer AND Simon Martin AND Philipp. 2023.
“The Heterogeneous Effects of Entry on Prices.”CEPR
Discussion Paper No. 18297.
Schultz, Christian. 2005. “Transparency on the Consumer Side and
Tacit Collusion.”European Economic Review 49 (2):
279–97.
Schultz, Christian. 2017. “Collusion in Markets with Imperfect
Price Information on Both Sides.”Review of Industrial
Organization 50 (3): 287–301.
Stahl, Dale O. 1989. “Oligopolistic Pricing with Sequential
Consumer Search.”American Economic Review 79 (4):
700–712.
Swanson, Matthew Grennan AND Ashley. 2020. “Transparency and
Negotiated Prices: The Value of Information in Hospital-Supplier
Bargaining.”Journal of Political Economy 128 (4):
1234–68.
Tappata, Mariano. 2009. “Rockets and Feathers: Understanding
Asymmetric Pricing.”RAND Journal of Economics 40 (4):
673–87.
Varian, Hal. 1980. “A Model of Sales.”American
Economic Review 70 (4): 651–59.
Wu, David P. Byrne AND Nicolas de Roos AND Matthew S. Lewis AND Leslie
M. Marx AND Xiaosung. 2023. “Asymmetric Information Sharing in
Oligopoly: A Natural Experiment in Retail Gasoline.”Mimeo.